A Guide to Manage Bioinformatics Data in SQL Database
Dedicated to Tamerlan.
The world belongs to those who believe in the beauty of their dreams
-- Not Random Indonesian Girl
Many bioinformaticians excel at processing genetic data but have limited exposure to modern database practices. This tutorial aims to help laboratory specialists enhance their data management skills by building a practical SQLite database for PLINK genotype data.
PLINK data, widely used in genetic analysis for applications like disease risk assessment and pharmacogenomics, typically exists in text-based formats. We'll demonstrate how to transform this data into a queryable SQL database using Python, following current best practices. This approach will introduce bioinformatics professionals to essential database skills while working with familiar genetic data.
Our step-by-step guide will cover:
- Setting up a Python project for database operations
- Converting PLINK text files to SQLite format
- Accessing the database through DBeaver
This tutorial is designed for bioinformaticians and other Data Clerks looking to expand their technical toolkit without disrupting their current workflow.
Python Project Components
FastAPI
Imagine our web application being a receptionist, whenever someone requests data, FastAPI handles it in a super fast manner (hence the name) making it easy to create APIs, which is a way different programs talk to each other. In our example when we want to store PLINK data into a database, FastAPI would handle that request and send back the results.
SQLModel
Think of it as a translator between your Python code and your database. It helps you work with your database and define precise structure for your PLINK data. Some experienced Data Specialists may consider it as an alternative to SQLAlchemy.
UV
And last, but not least the Python Package manager written in Rust, providing ease of use when it comes to start a project quick and clean. Thus might be considered as alternative to pip. It creates Git branch, virtual environment, keep track of your project dependencies and so much more.
Set up
First we need to open our Terminal and install our components and set up the project, let's do this typing following commands into our terminal:
Install UV
if using Linux / Windows
pip install uv
or using Mac
brew install uv
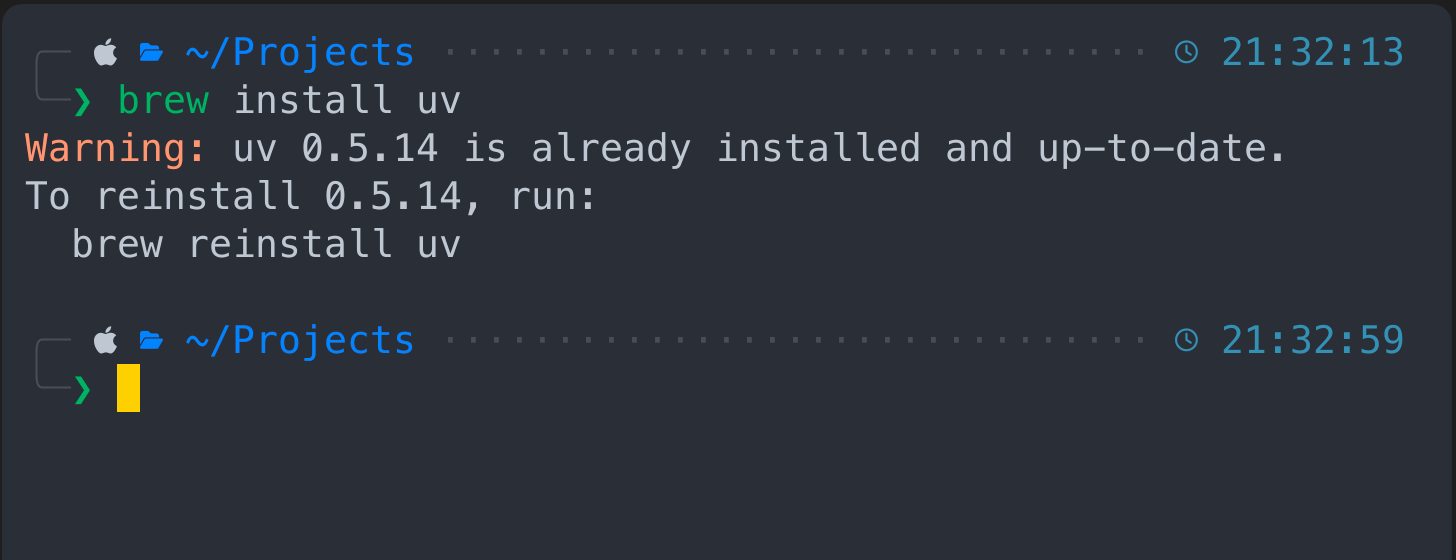 In my case I have it installed, so nothing really happens here after the prompt.
Create Project
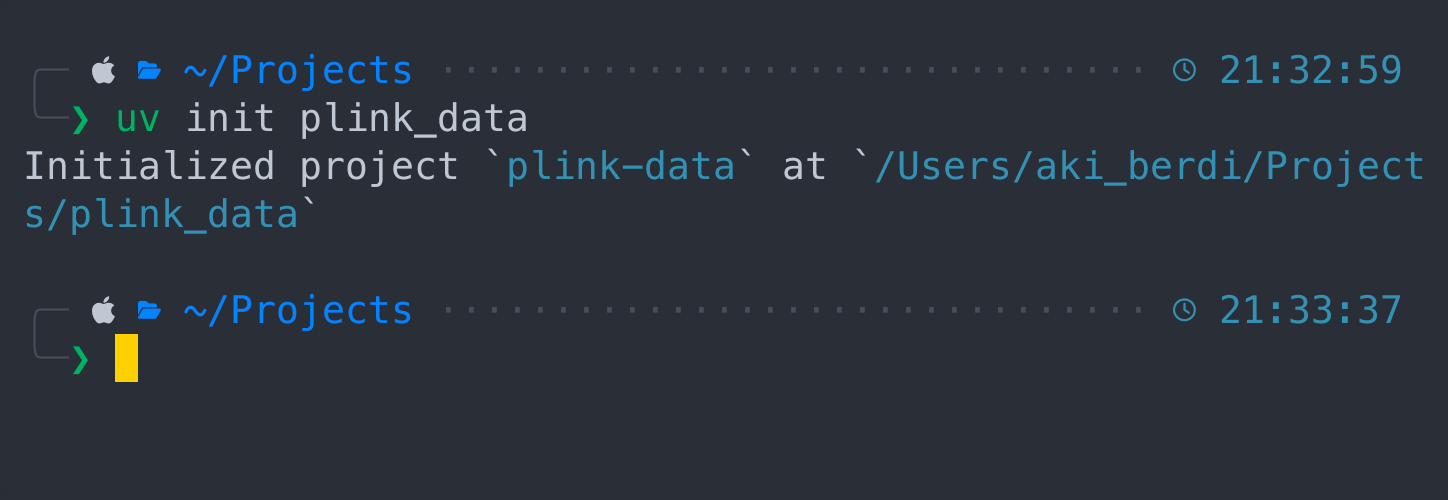
Now let's initiate the project with UV
uv init plink_data
 Change directory to a new project via "cd plink_data" and type "ls" to see files inside the project.
cd plink_data
ls
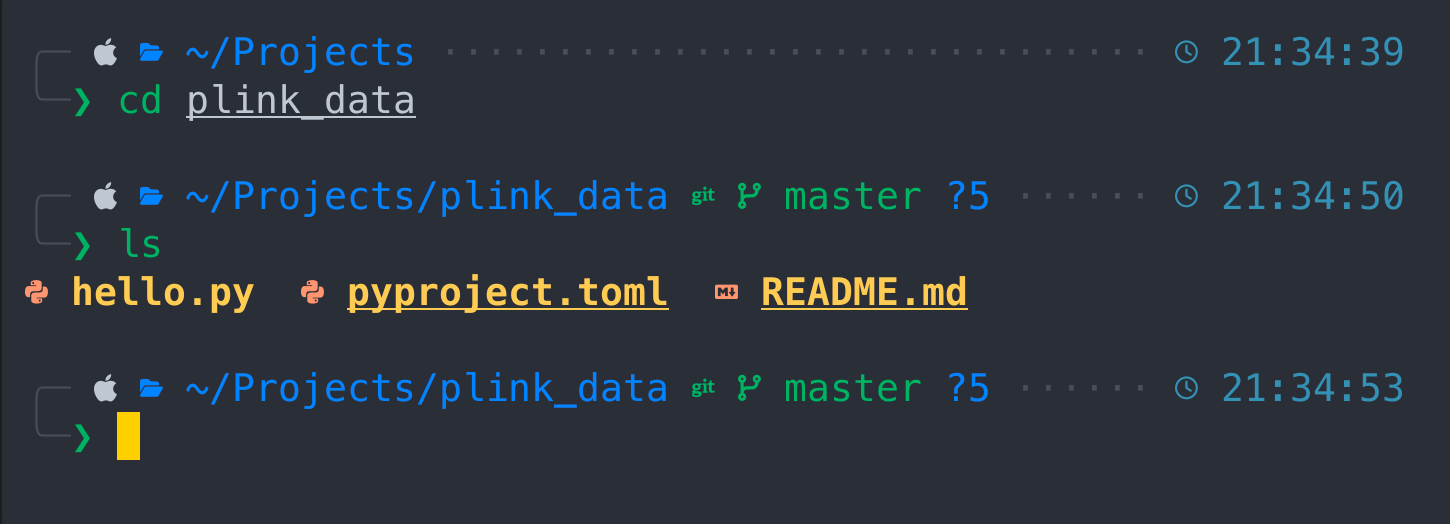 As soon as we switched to plink_data project we can see three basic files here
- hello.py
- pyproject.toml
- README.md
We also have initialized git project. Let's explore it first
git status
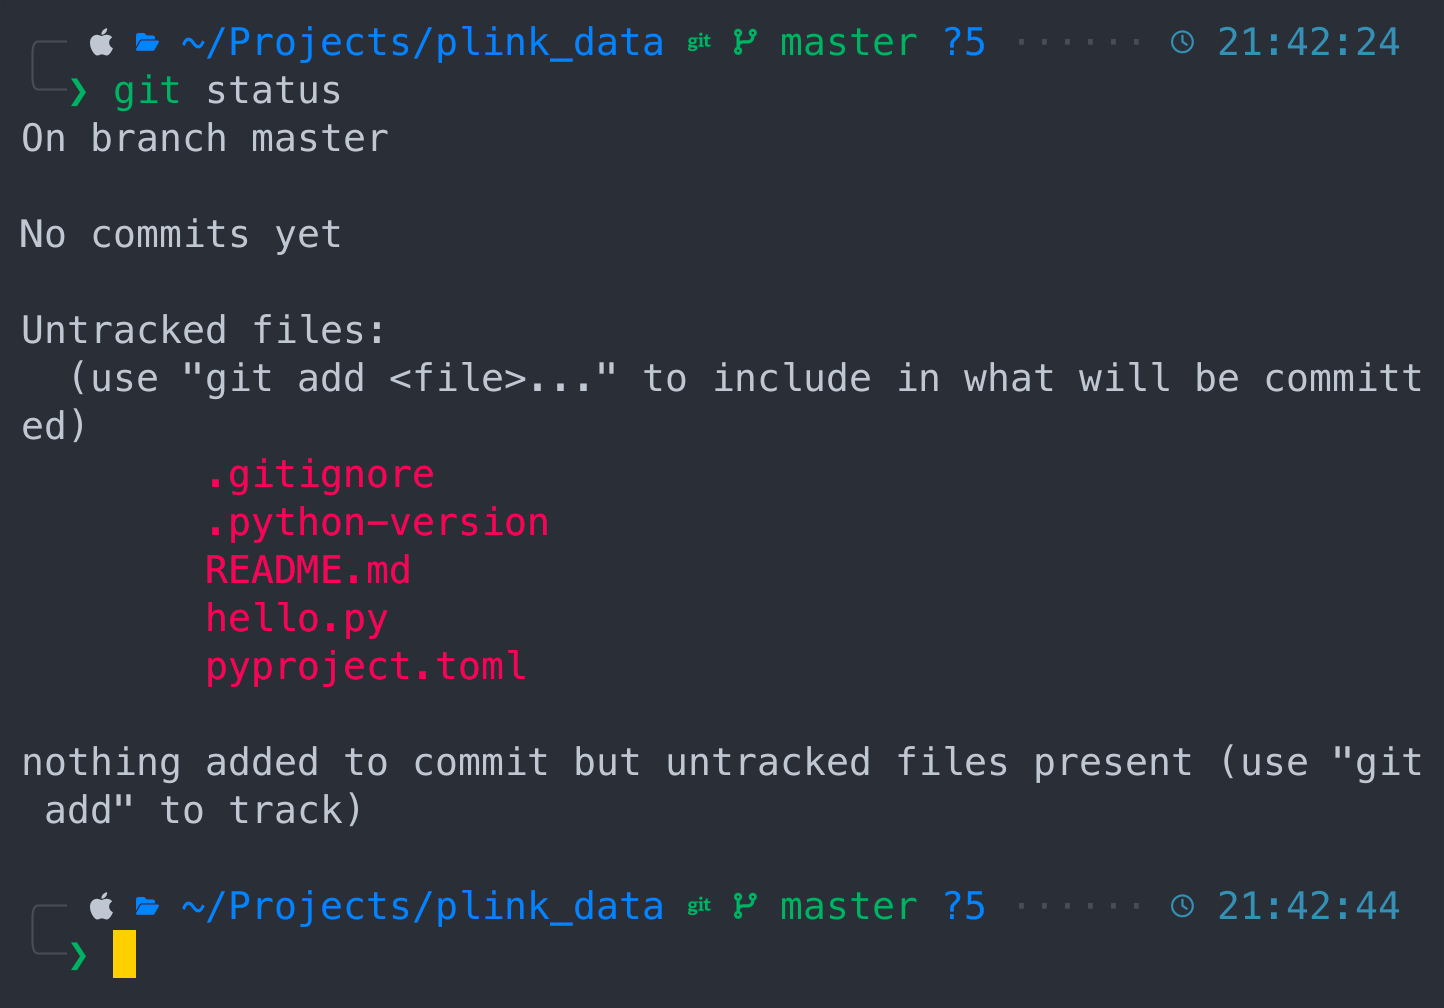 Git says we are at master branch with no commits and couple of untracked files. If you don't know what Git is, then don't mind and let's keep up with our project. Let's kick it off
uv run hello.py
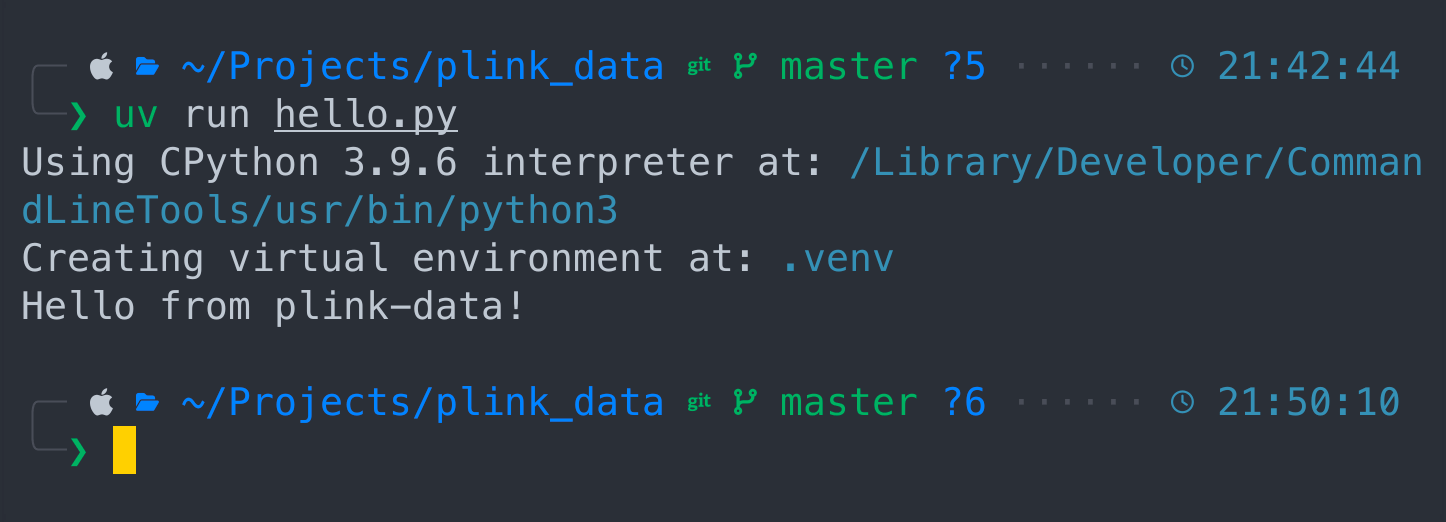 We just ran our project with CPython, created virtual environment and received greetings from plink-data project. Good job so far !
Now let's add our project components by running following command
uv add fastapi sqlmodel python-multipart uvicorn
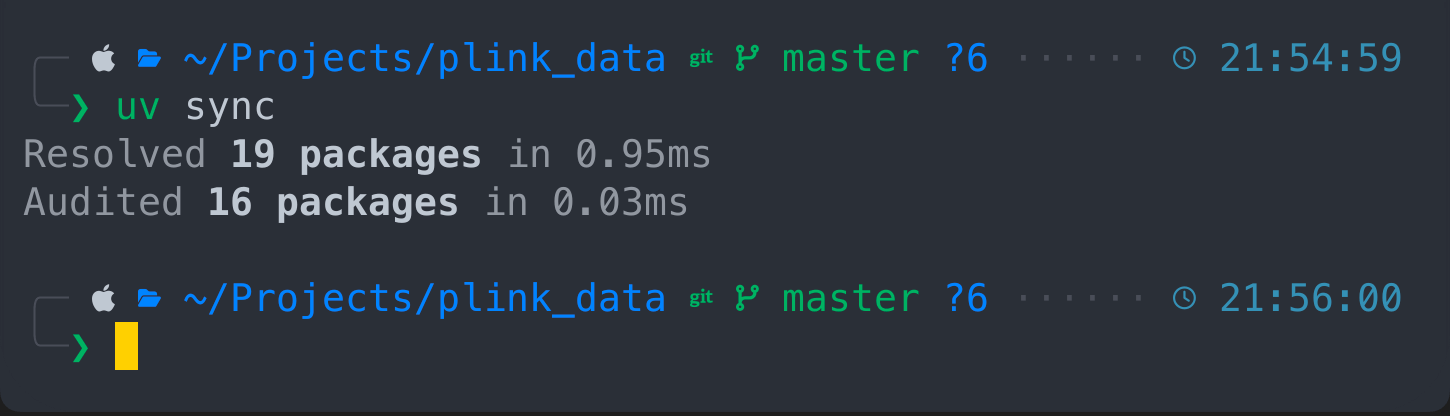
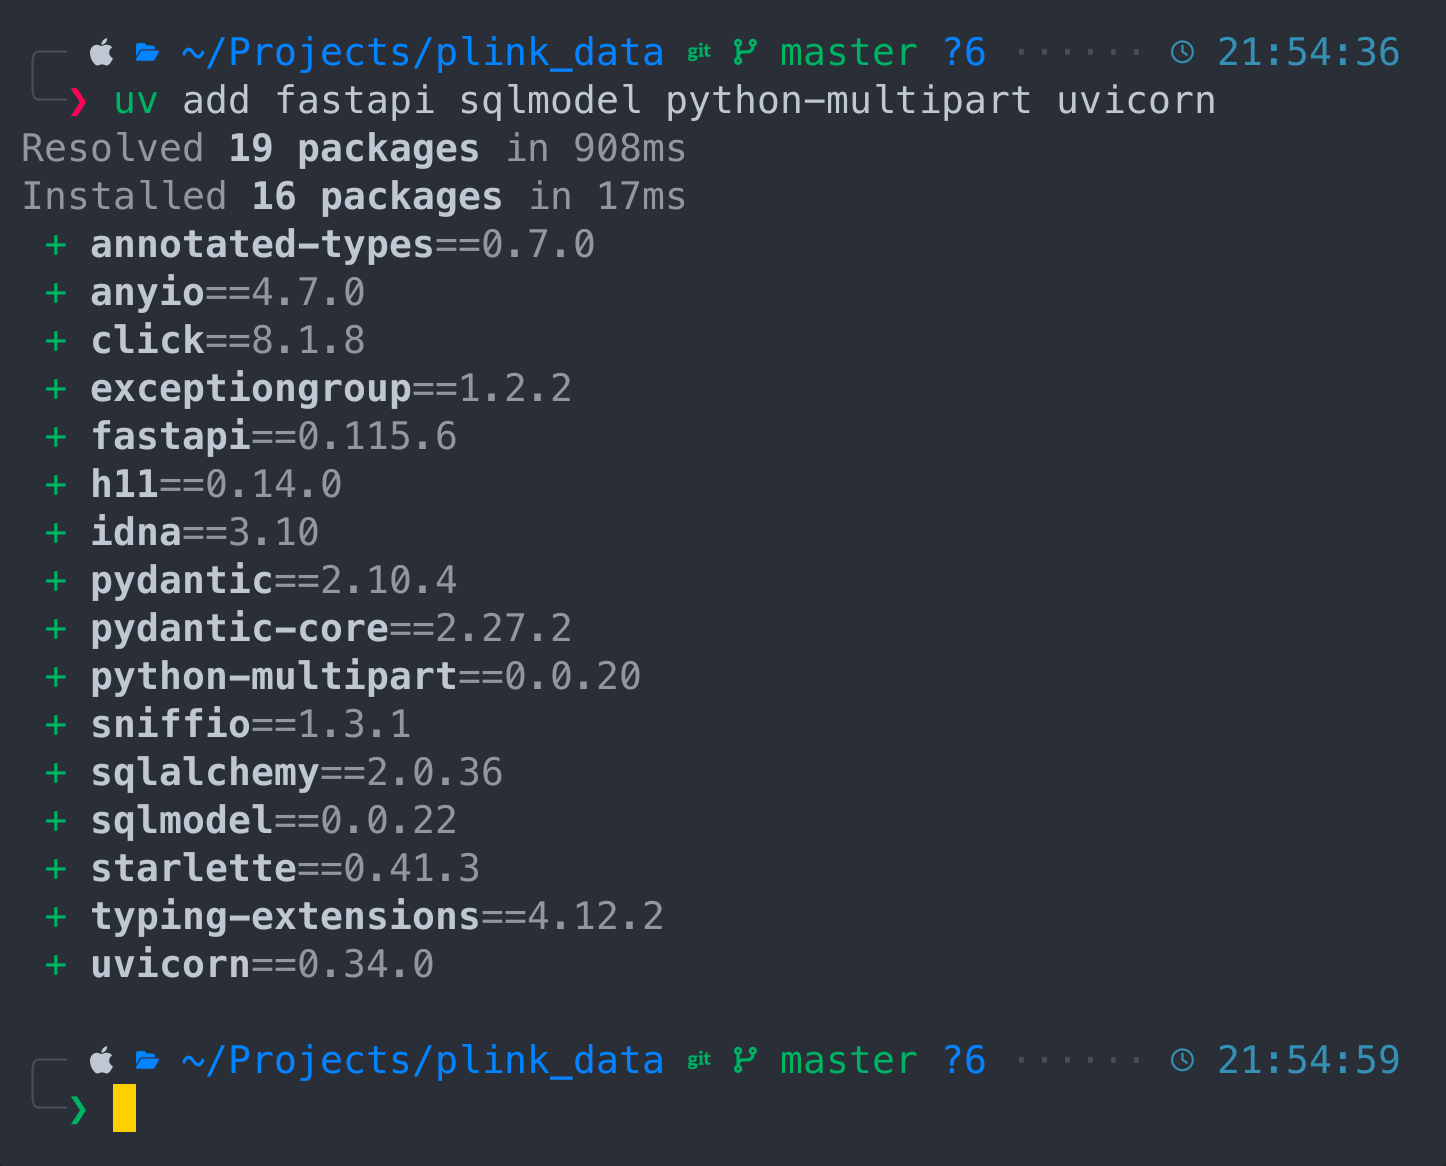 All components being installed and we can synchronize them
uv sync
 Also we can see the project dependencies structure
uv tree
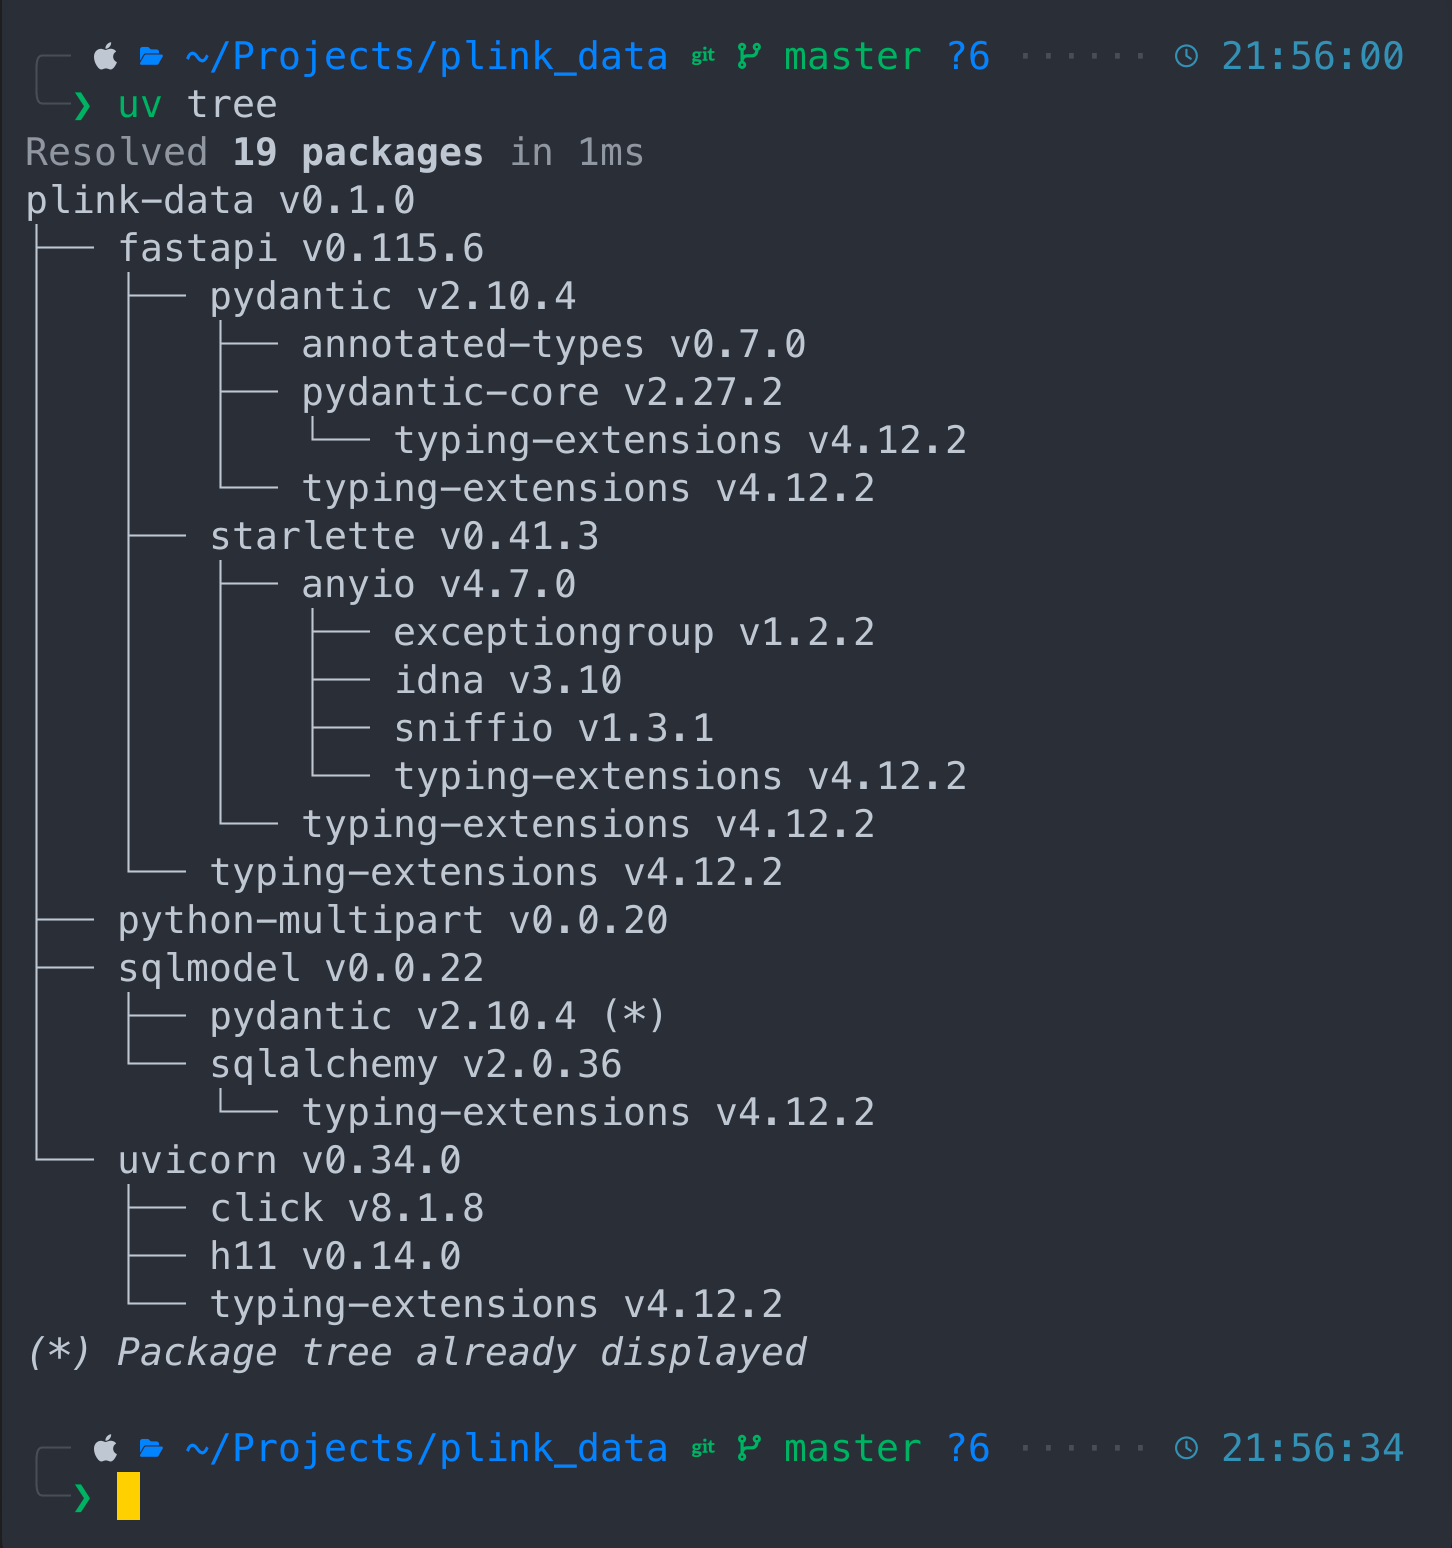
Our plink-data project and it's components like fastapi which depends on pydantic and starlette, sqlmodel depend on sqlalchemy and so on. Now let's activate our python virtual environment
. .venv/bin/activate
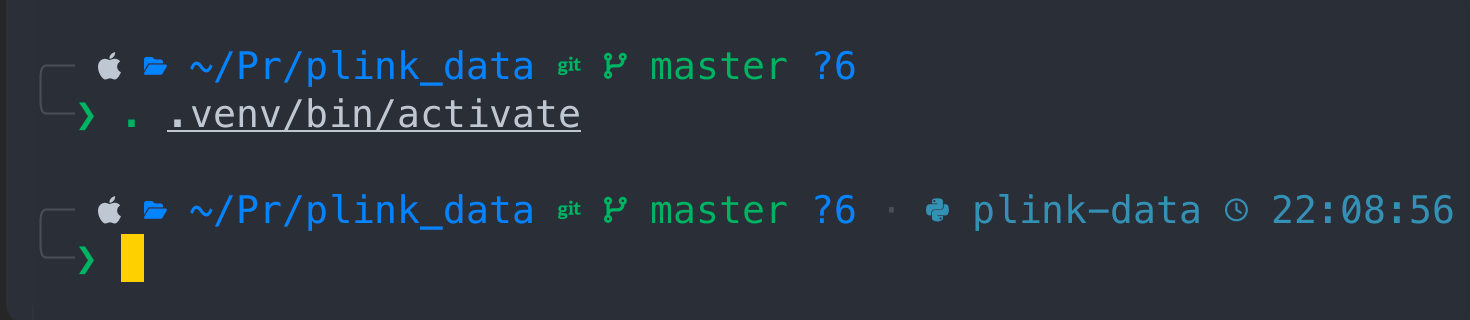 By following this steps we accomplished to set up our project in a couple of minutes without wasting our time on creating git project , virtual environment and declare our dependencies. UV made it for us, and it's bad ass. Now let's write some source code
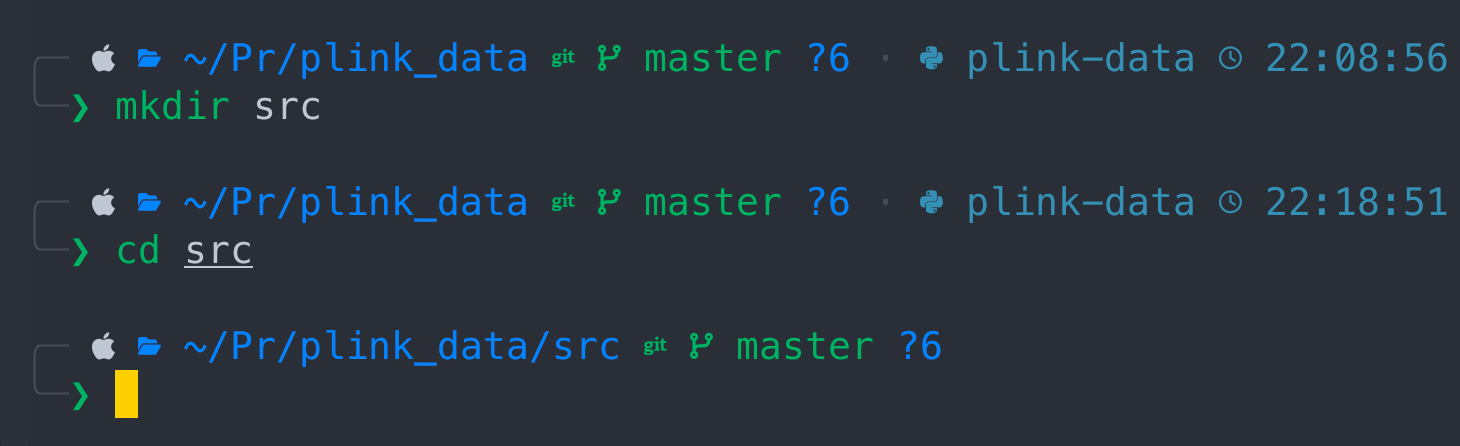
SRC
Let's create source directory where the main python code would live
mkdir src
cd src
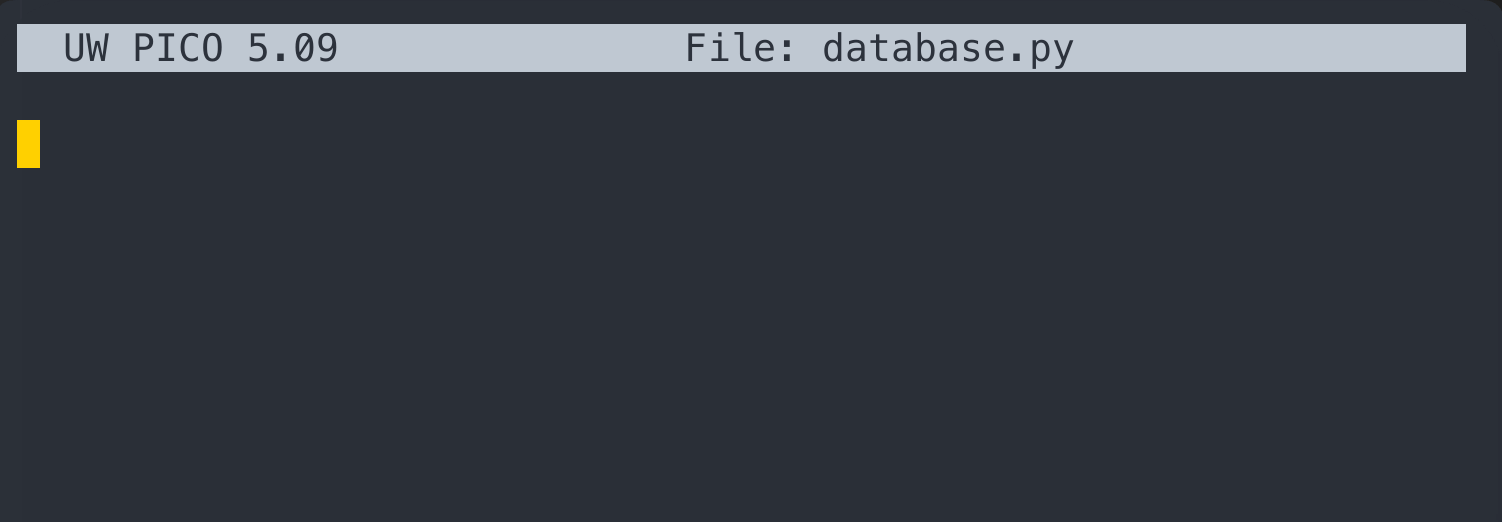
Database
Here we would need to define a database structure
nano database.py
 Here we would need to write following
from sqlmodel import SQLModel, create_engine

DATABASE_URL = "sqlite:///genotypes.db"
engine = create_engine(DATABASE_URL)

def create_db_and_tables():
    SQLModel.metadata.create_all(engine)
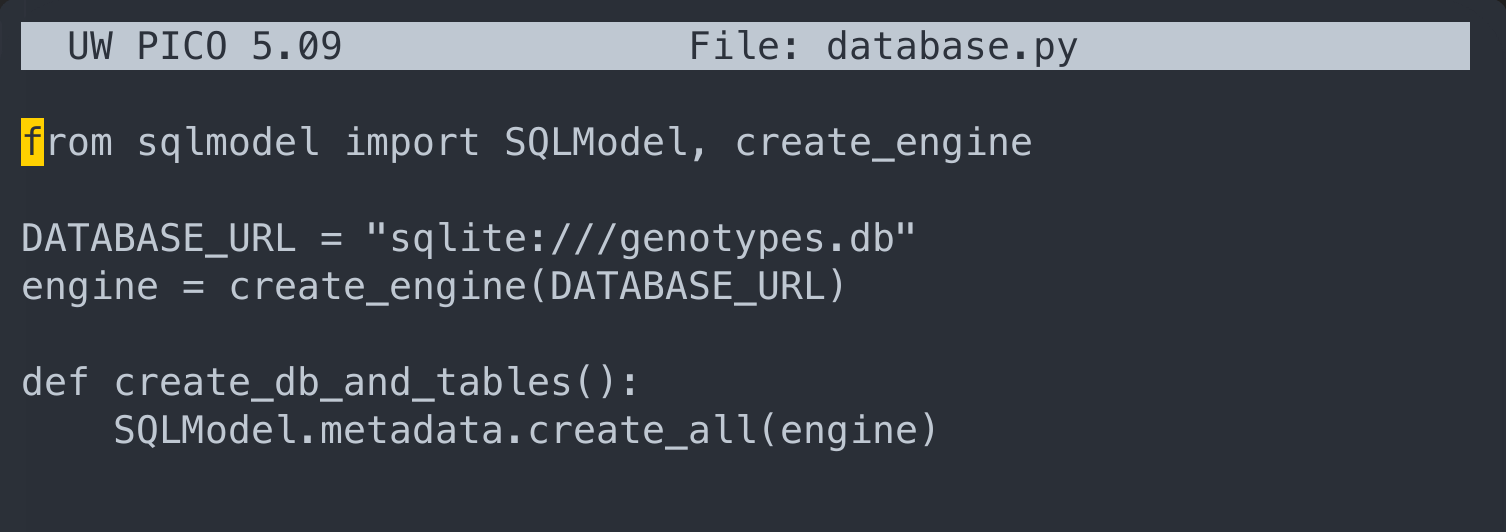 then press Ctrl + X, and press "Y" and "ENTER" to save content
cat database.py
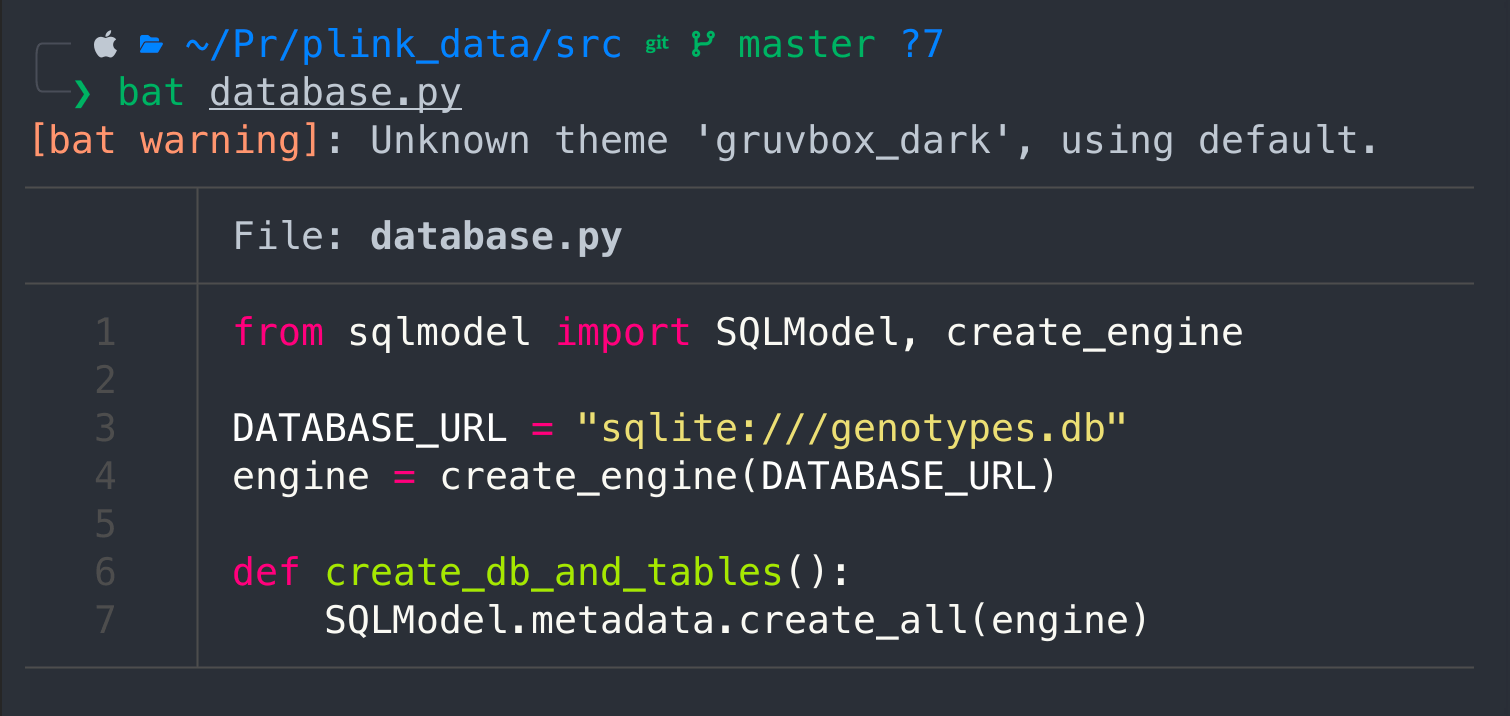
I actually use bat, but it's an additional feature that has to be installed first, however cat would give you the same results, but without syntax highlight.
Models
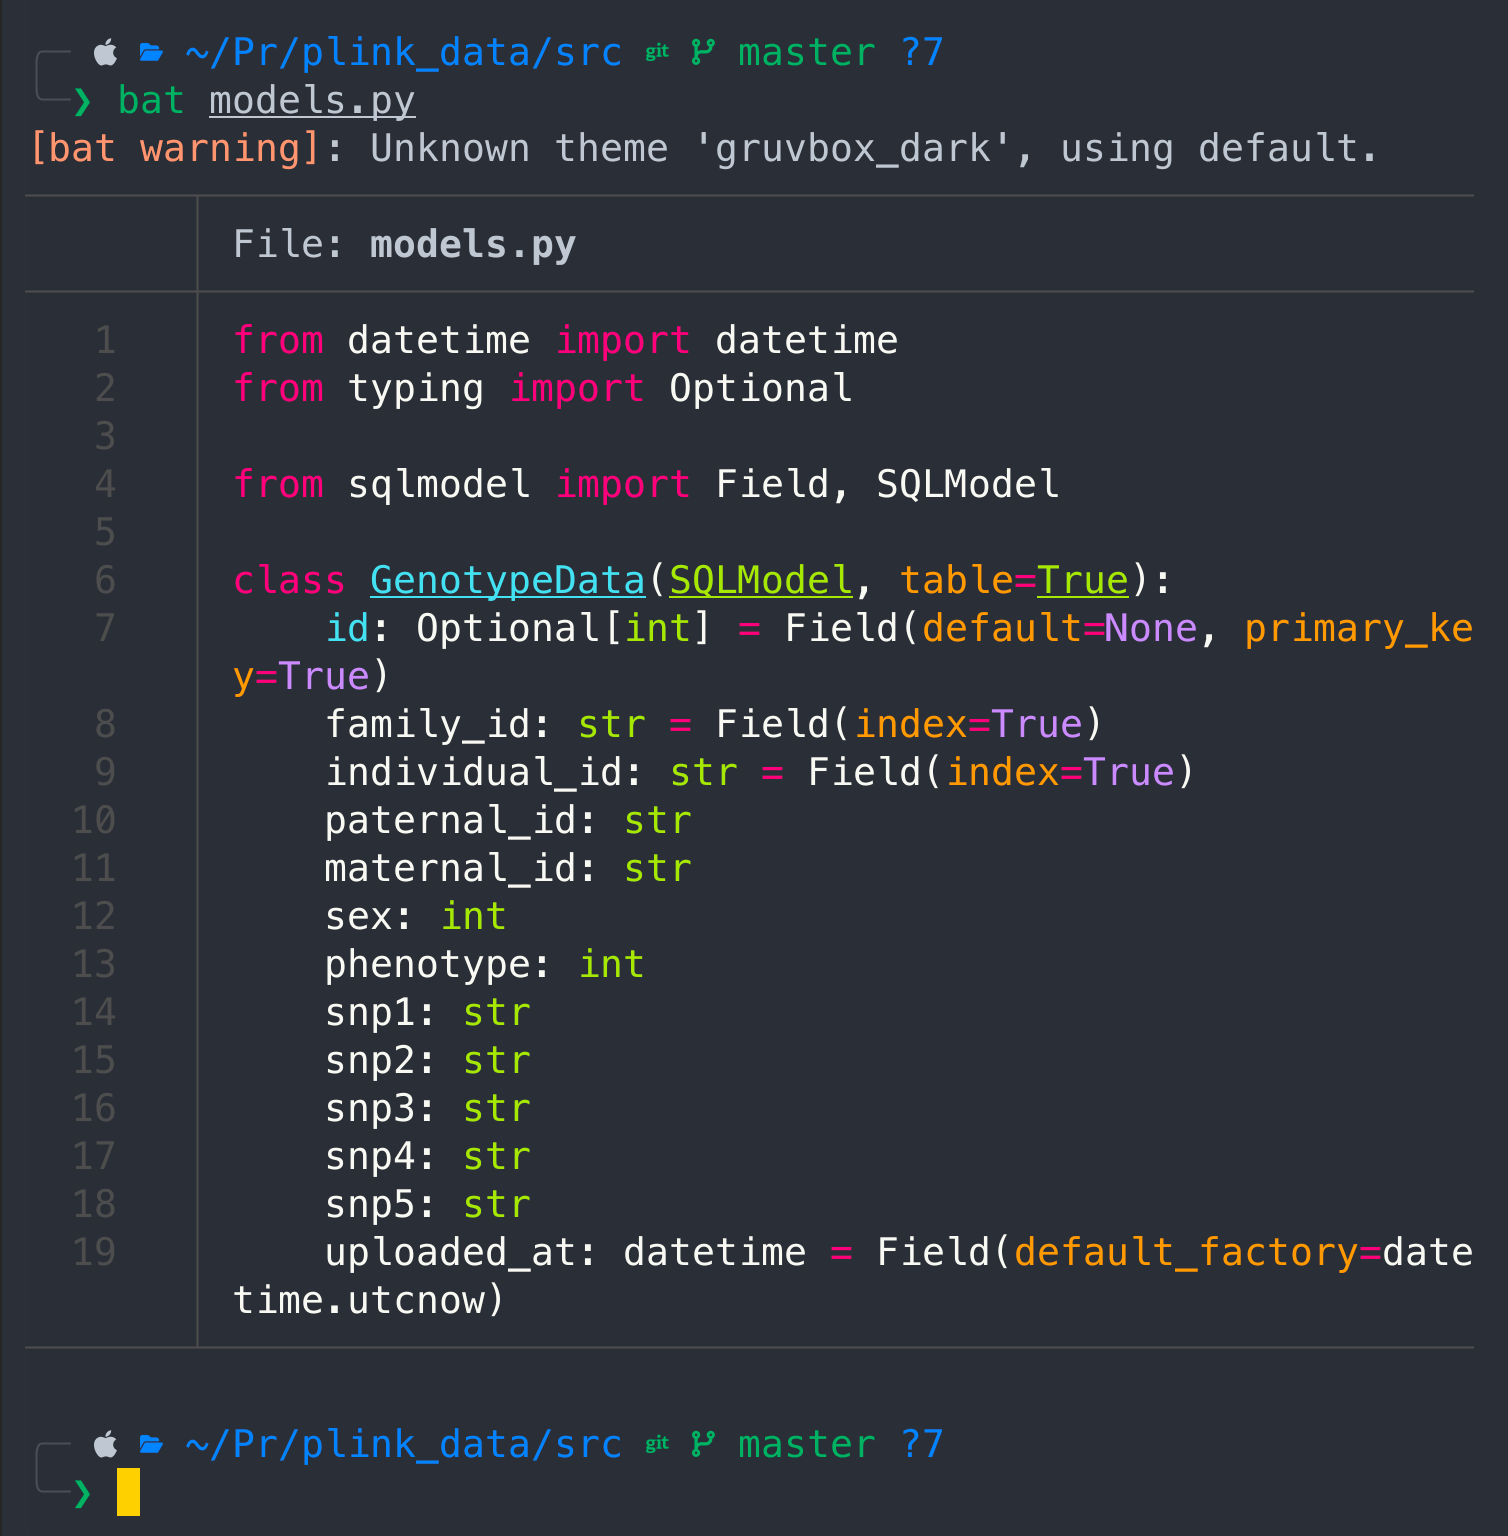
nano models.py
The following code would create a class for GenotypeData, i.e the PLINK data structure
from datetime import datetime
from typing import Optional

from sqlmodel import Field, SQLModel

class GenotypeData(SQLModel, table=True):
    id: Optional[int] = Field(default=None, primary_key=True)
    family_id: str = Field(index=True)
    individual_id: str = Field(index=True)
    paternal_id: str
    maternal_id: str
    sex: int
    phenotype: int
    snp1: str
    snp2: str
    snp3: str
    snp4: str
    snp5: str
    uploaded_at: datetime = Field(default_factory=datetime.utcnow)
Save it with Ctrl + X, press "Y" and "ENTER", and check the content
cat models.py
Main
Create main python file
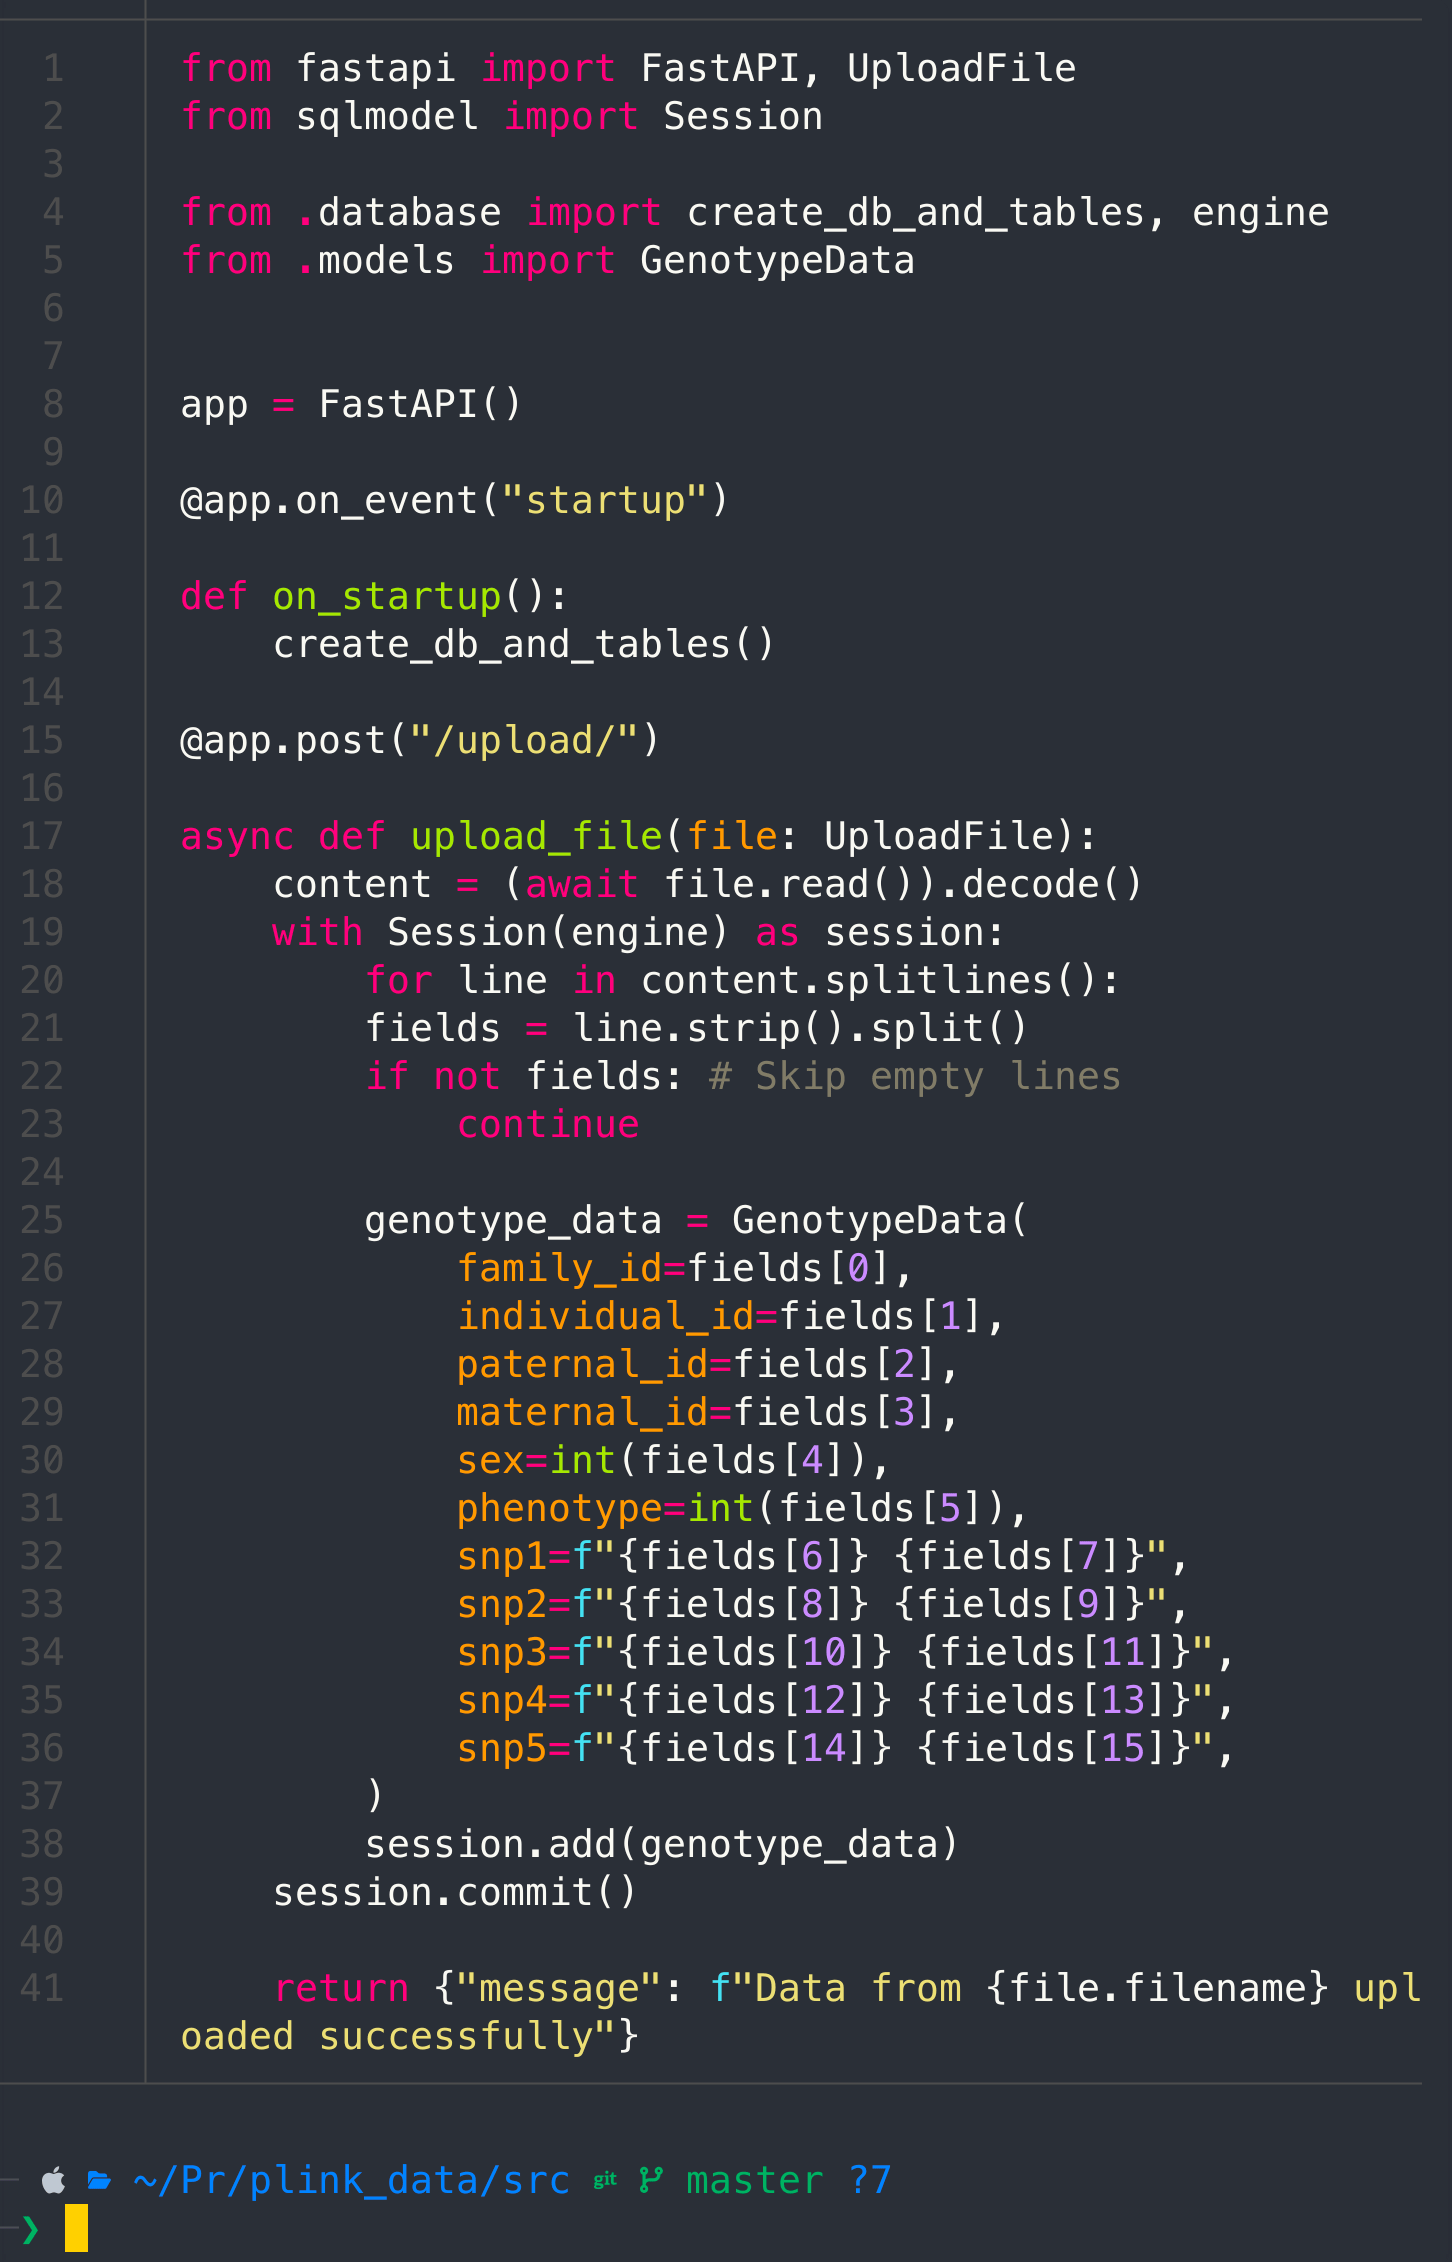
nano main.py
Pass the following code
from fastapi import FastAPI, UploadFile
from sqlmodel import Session

from .database import create_db_and_tables, engine
from .models import GenotypeData


app = FastAPI()

@app.on_event("startup")

def on_startup():
 create_db_and_tables()

@app.post("/upload/")

async def upload_file(file: UploadFile):
 content = (await file.read()).decode()
 with Session(engine) as session:
  for line in content.splitlines():
  fields = line.strip().split()
  if not fields: # Skip empty lines
   continue

  genotype_data = GenotypeData(
   family_id=fields[0],
   individual_id=fields[1],
   paternal_id=fields[2],
   maternal_id=fields[3],
   sex=int(fields[4]),
   phenotype=int(fields[5]),
   snp1=f"{fields[6]} {fields[7]}",
   snp2=f"{fields[8]} {fields[9]}",
   snp3=f"{fields[10]} {fields[11]}",
   snp4=f"{fields[12]} {fields[13]}",
   snp5=f"{fields[14]} {fields[15]}",
  )
  session.add(genotype_data)
 session.commit()

 return {"message": f"Data from {file.filename} uploaded successfully"}
cat main.py
Init
We also need a simple init file, this way we interpret whole src directory as the python package
touch __init__.py
And that's it.
Create a sample data or use your own
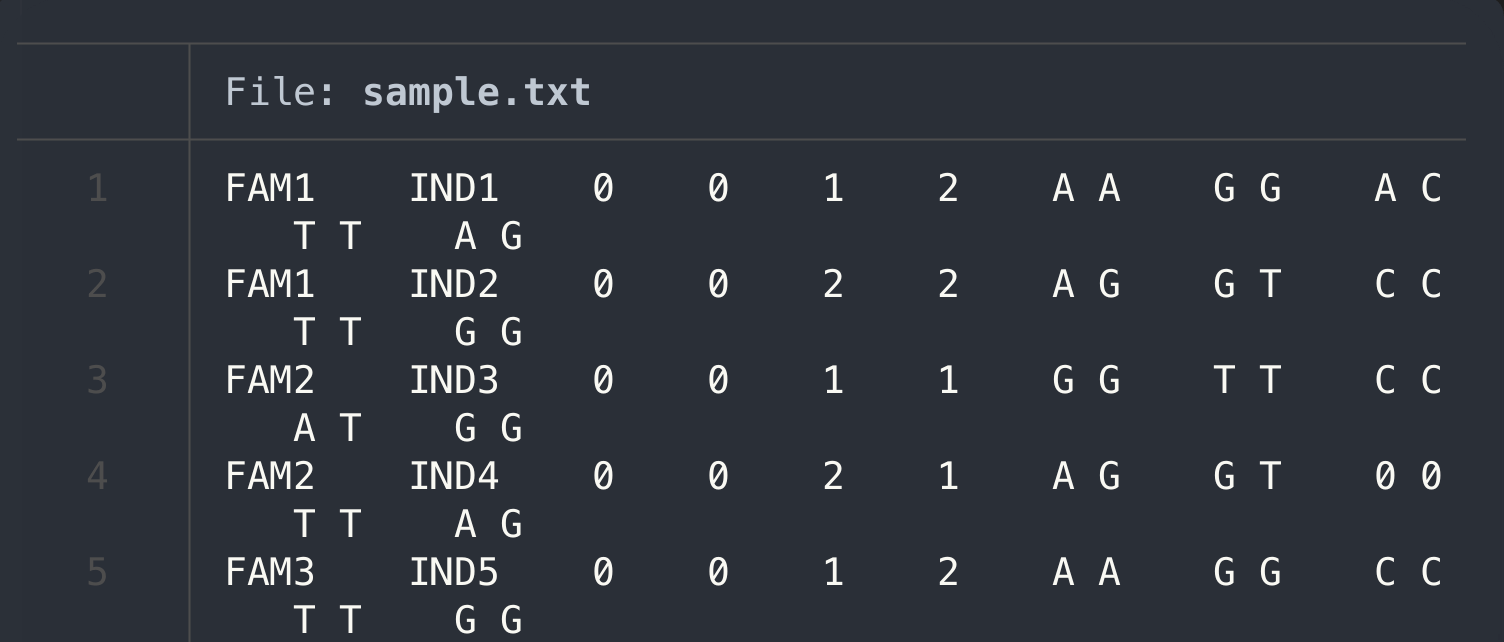
I will create a sample to ingest the data, if you have your own PLNIK data, feel free to upload your samples into the same folder we working on
nano sample.txt
FAM1    IND1    0    0    1    2    A A    G G    A C    T T    A G
FAM1    IND2    0    0    2    2    A G    G T    C C    T T    G G
FAM2    IND3    0    0    1    1    G G    T T    C C    A T    G G
FAM2    IND4    0    0    2    1    A G    G T    0 0    T T    A G
FAM3    IND5    0    0    1    2    A A    G G    C C    T T    G G
cat sample.txt
Upload sample
First we need to launch our application with the uvicorn command
uvicorn src.main:app --reload
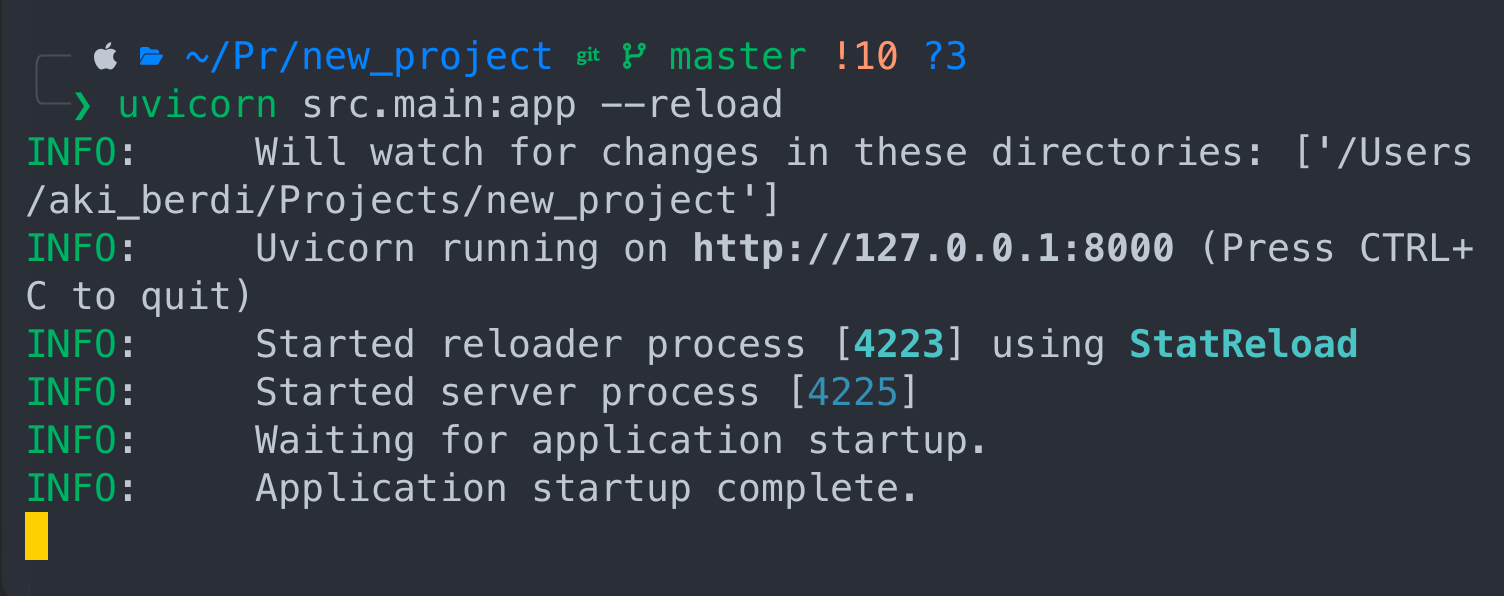 Cool! The app is live and running. The nuance is that we have to keep this terminal in it's current state and open another terminal to ingest the file.
In the new terminal write the following command:
Cool! The app is live and running. The nuance is that we have to keep this terminal in it's current state and open another terminal to ingest the file.
In the new terminal write the following command:
curl -X POST -F "file=@sample.txt" http://localhost:8000/upload/
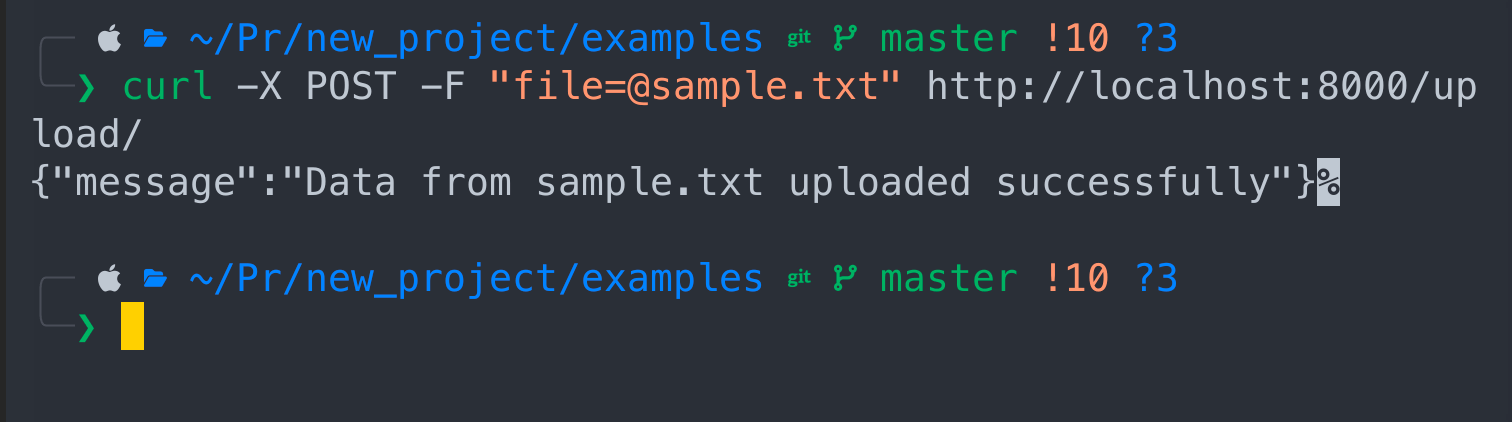
Congrats! Your data has been ingested.
Read data using SQL
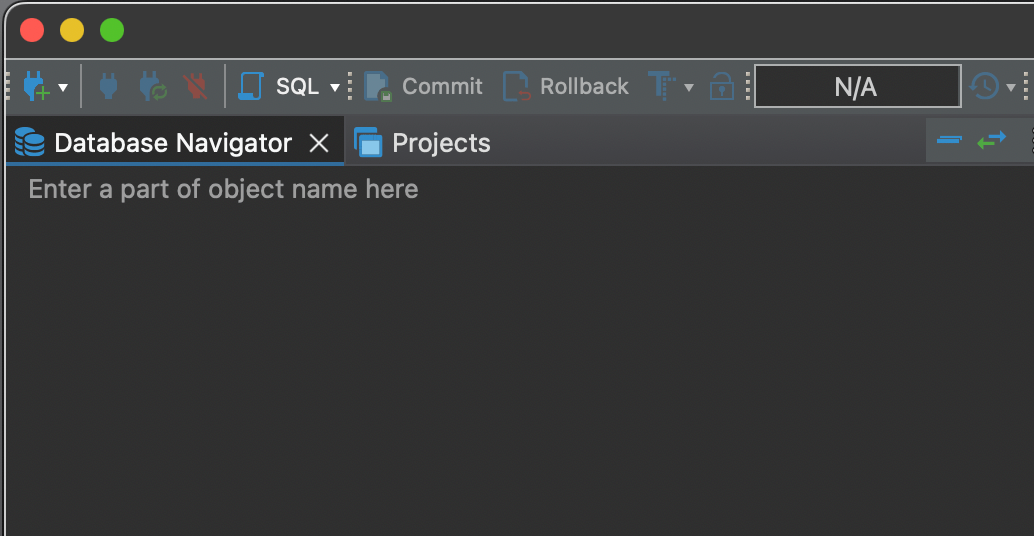
First you need a program that will allow you access your database with SQL. My way to go with SQL is dbeaver, but you can use any other program such as Data Grip for example. I have it installed, if you don't go to official website to download and install it. Community version is free.
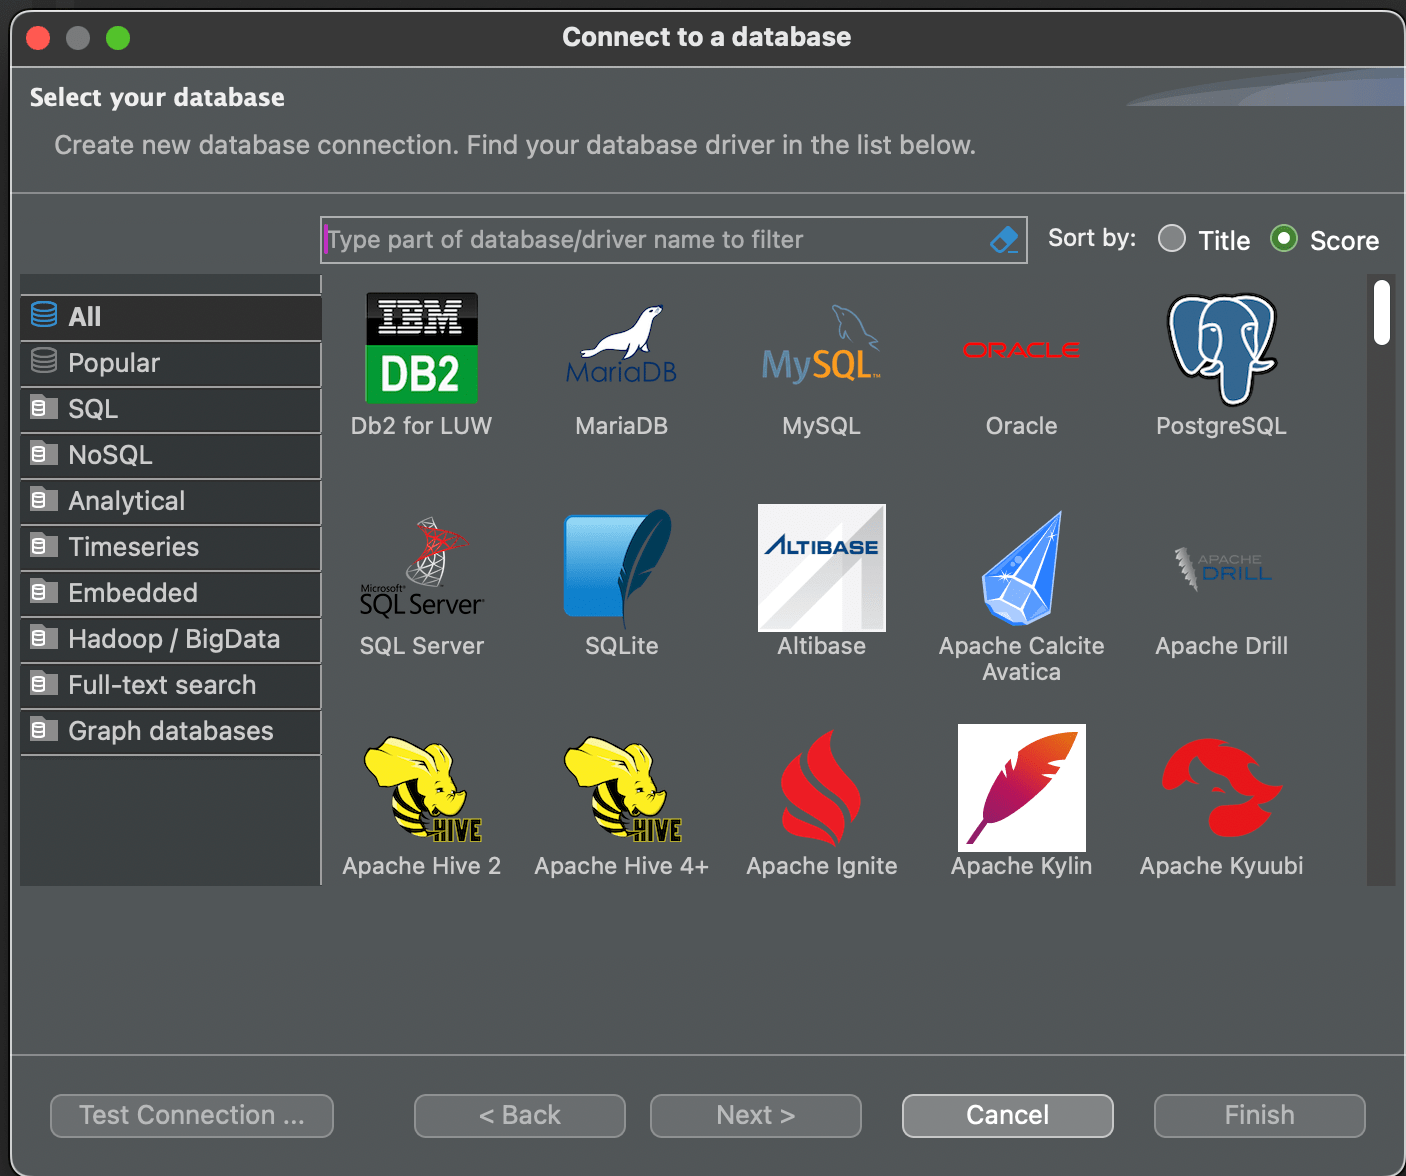
This is how interface look like, click on the socket + sign to add the database
 Choose SQLite and press Next
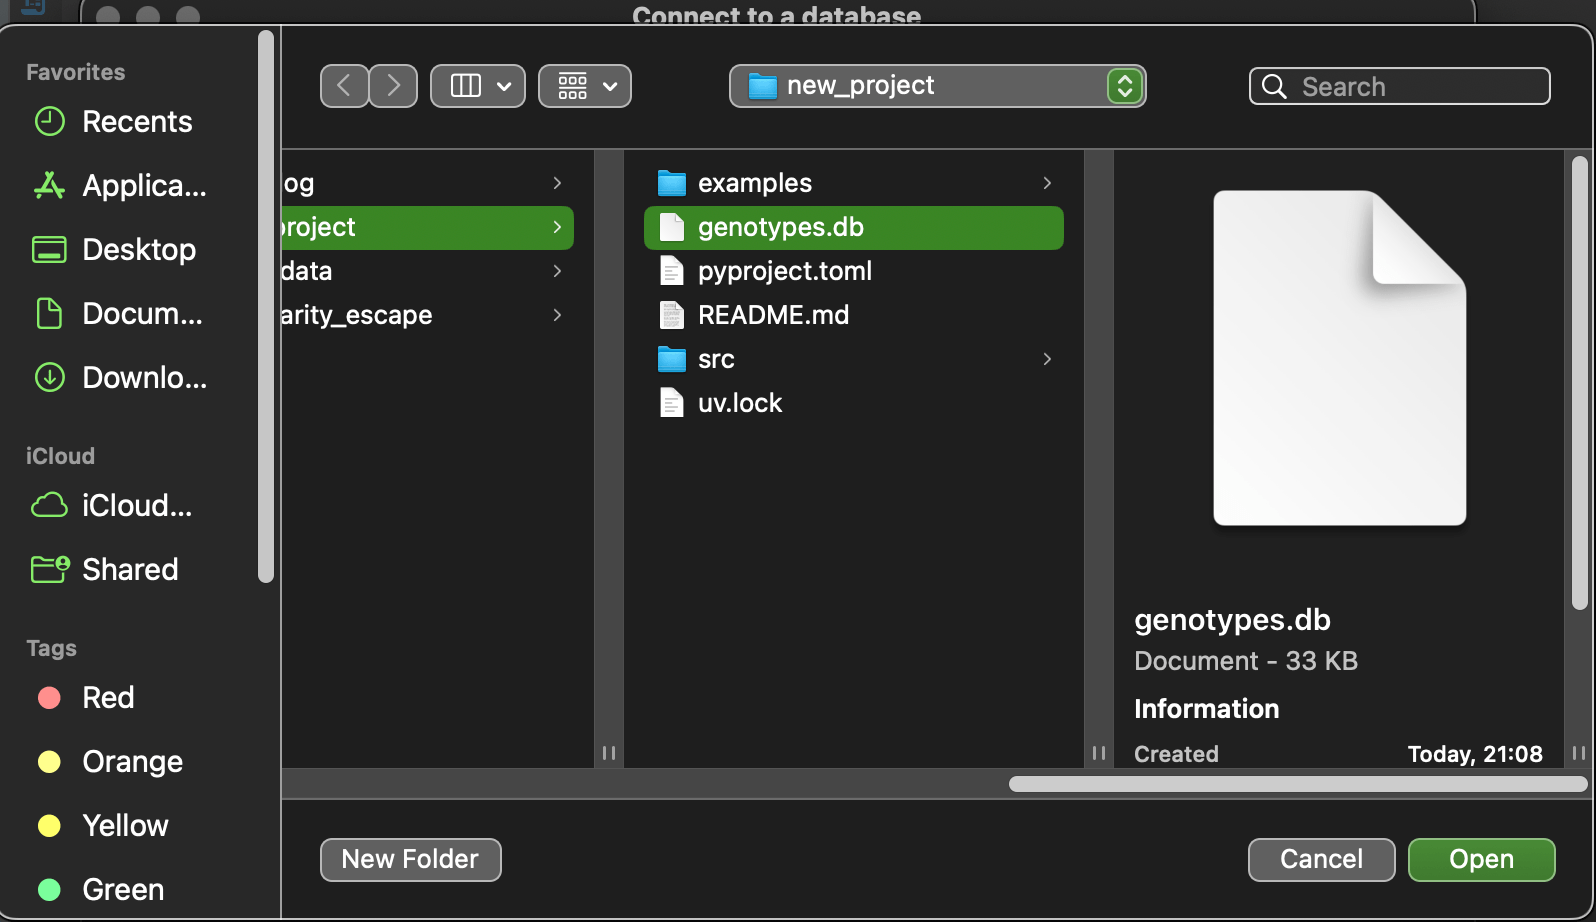
Press Open
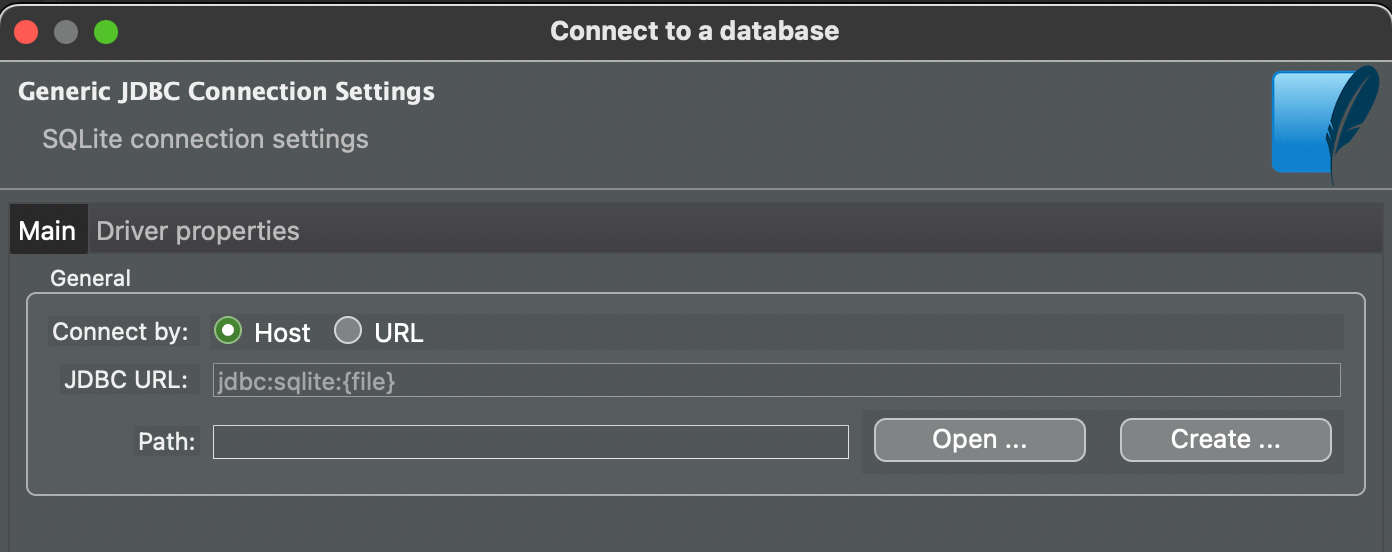
Then choose genotype.db file and press open and then finish
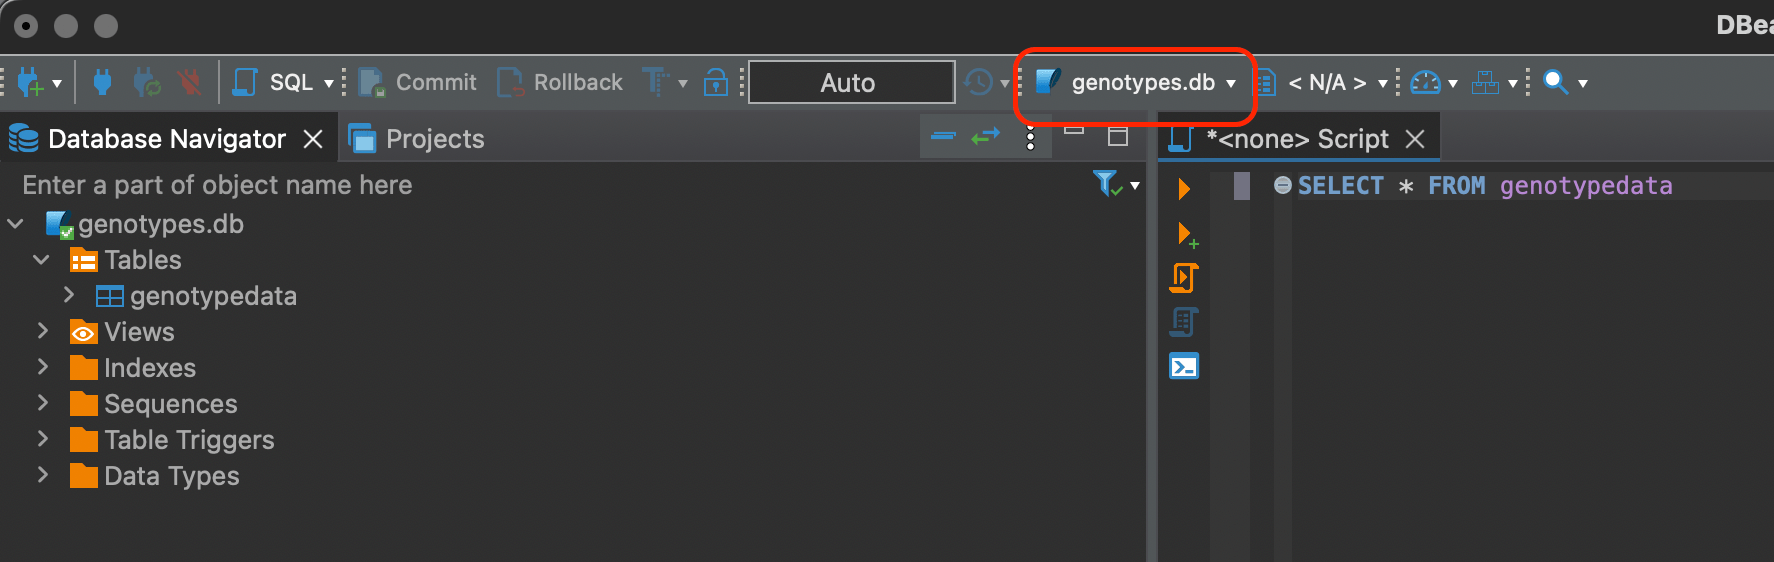
Look at the bar where genotypes.db connection is chosen instead of N/A. You have to explicitly choose it.
SQL
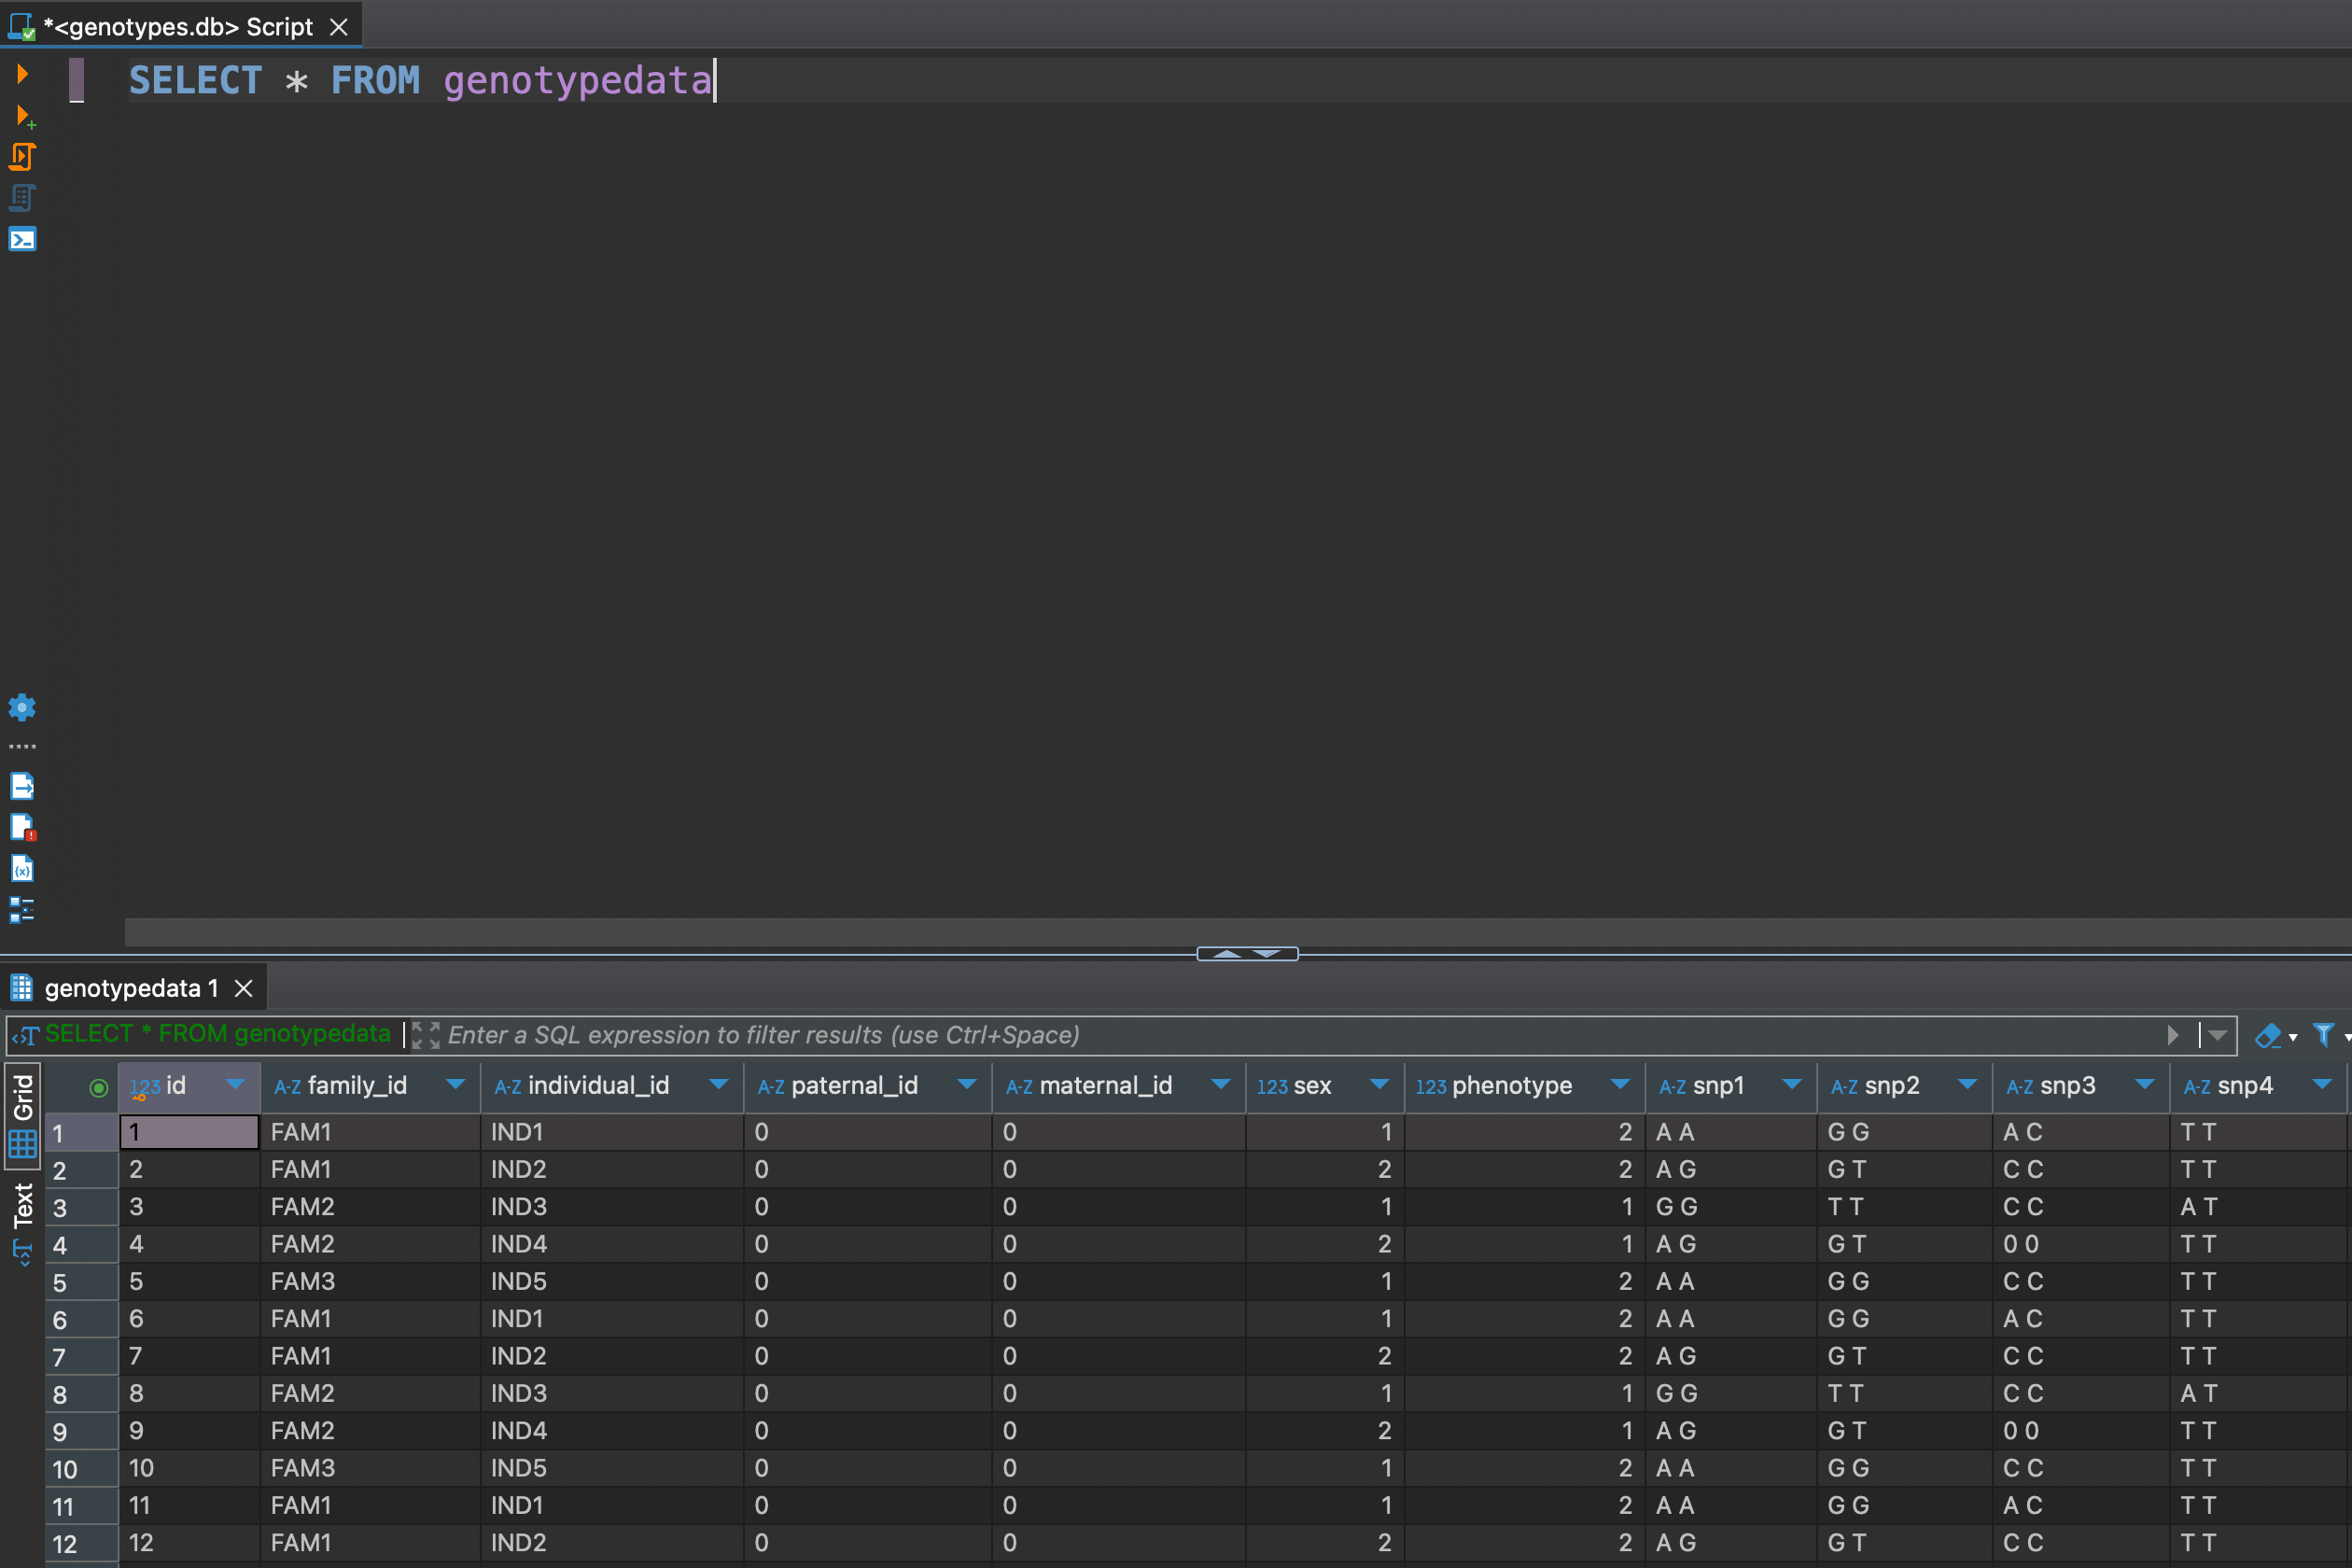
Now we can do some basic SELECT statements like so
SELECT * FROM genotypedata
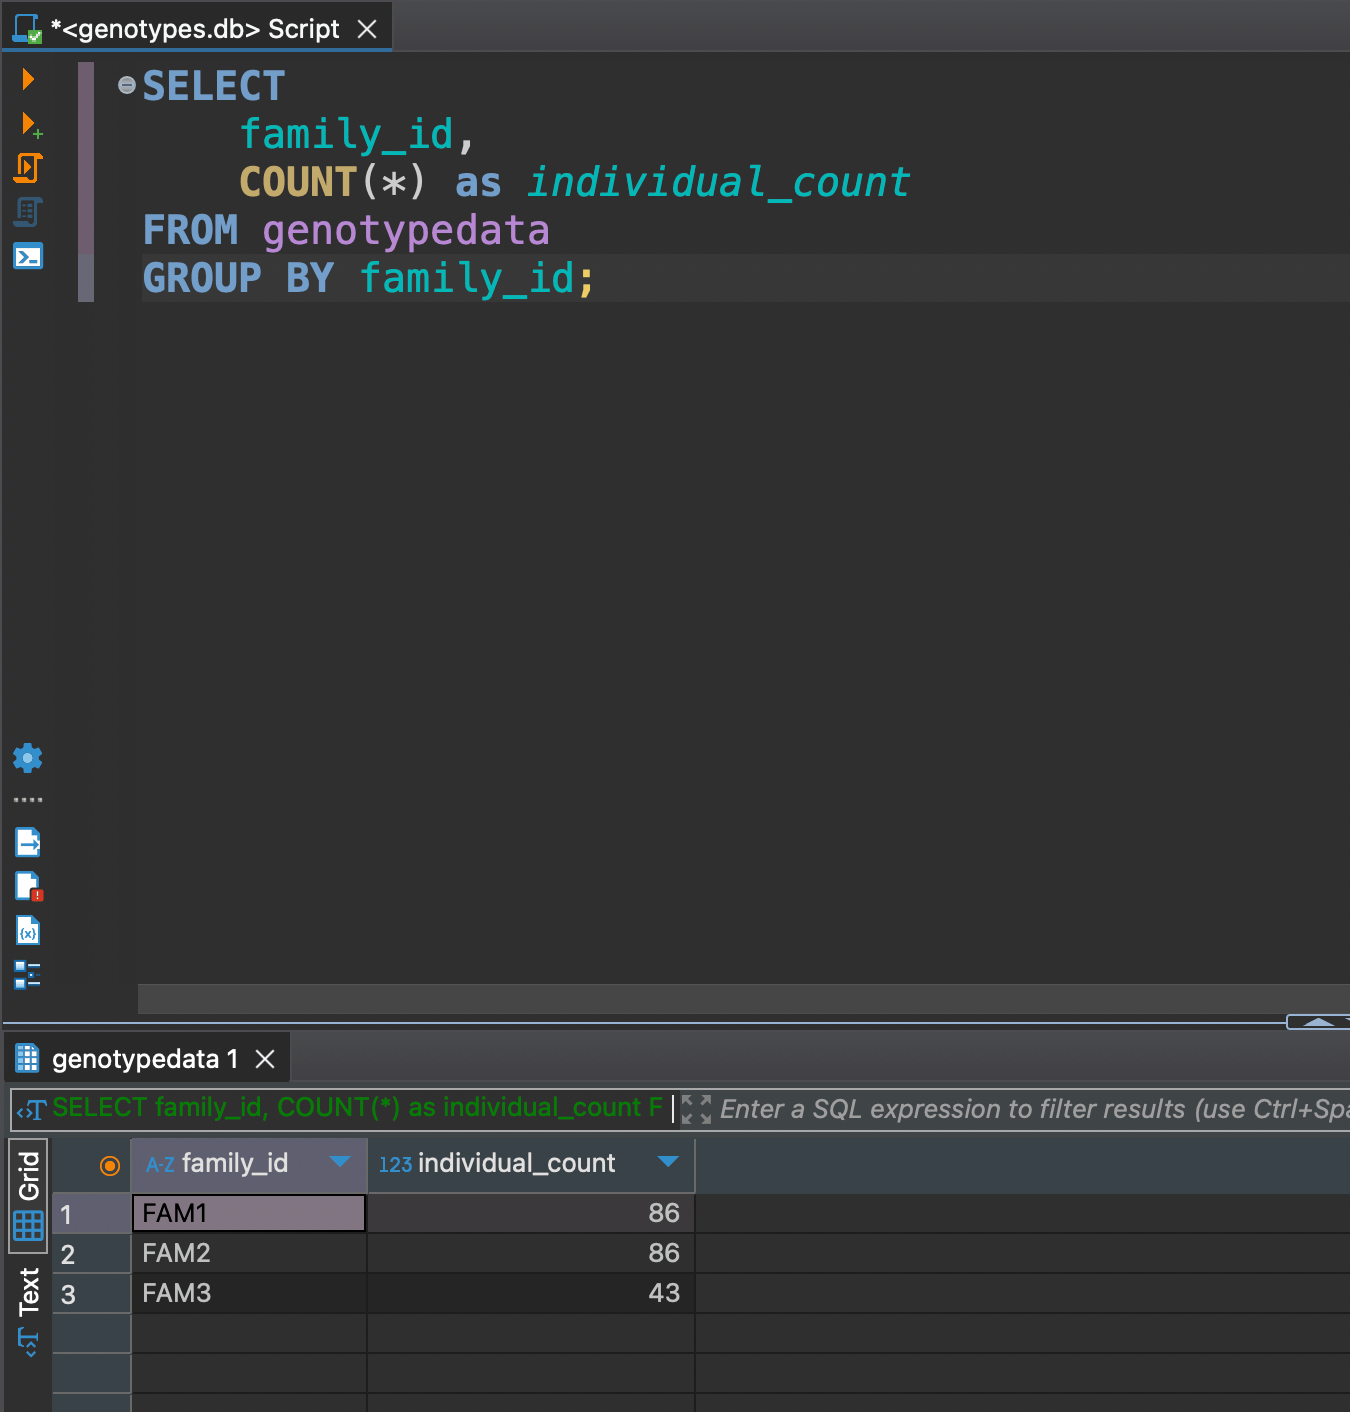
 Now as we got all data at hand, let's explore some DML (Data Manipulation Language) functionality. For example we might need to see how many individuals are in each familiy
SELECT
 family_id,
 COUNT(*) as individual_count
FROM genotypedata
GROUP BY family_id;
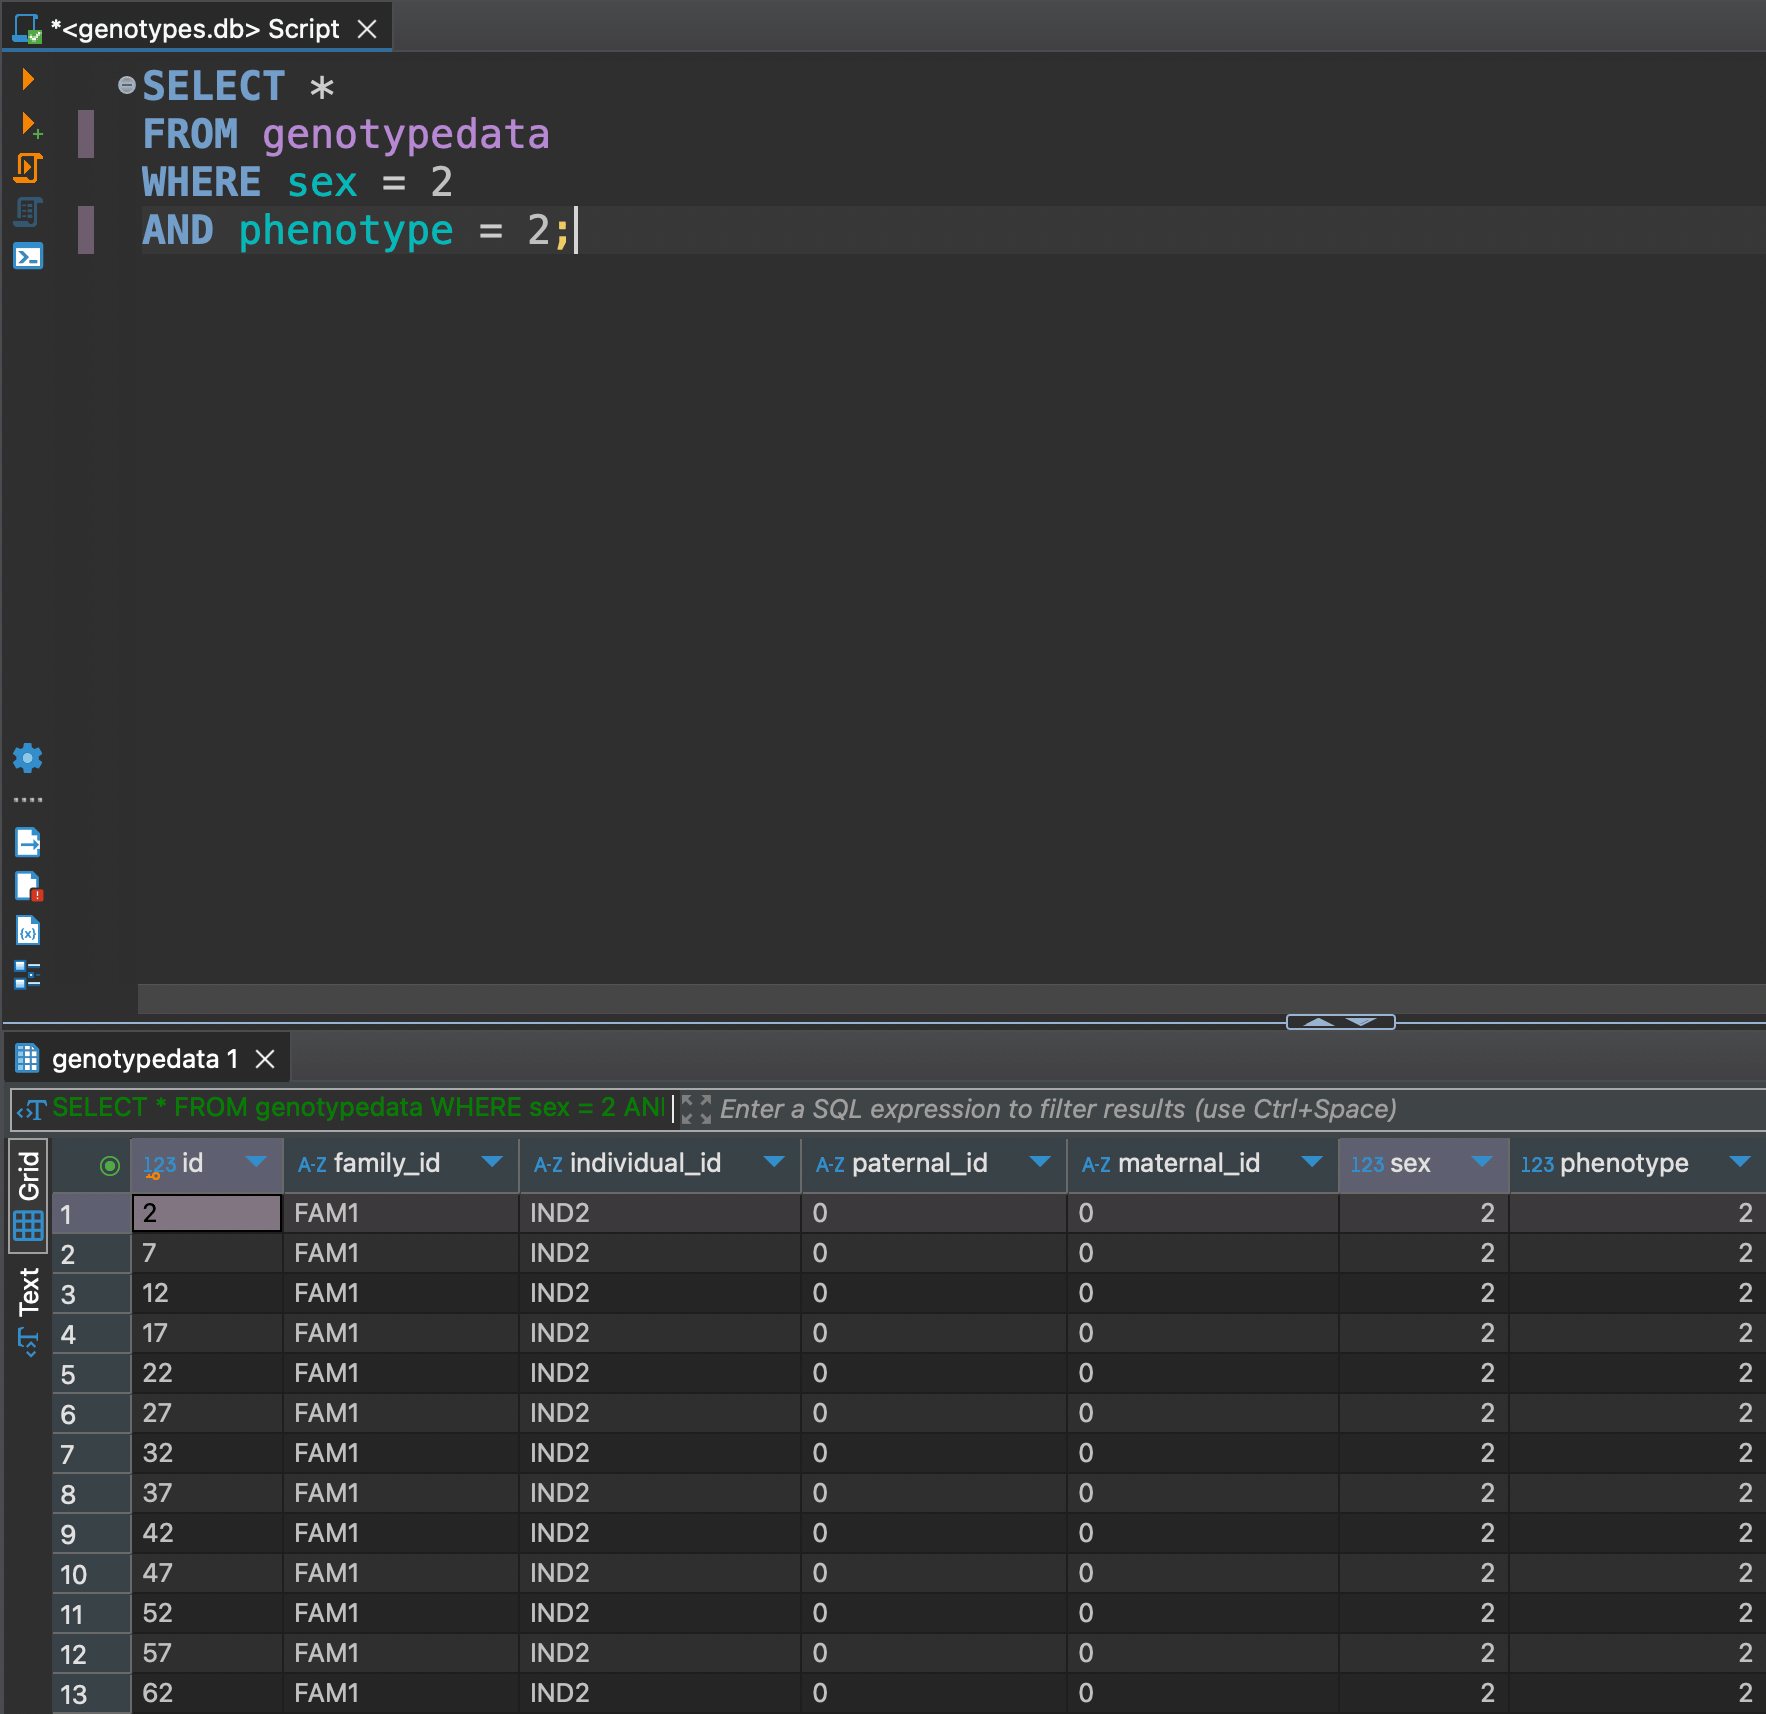
Or let's say we want to see only females with phenotype 2
SELECT *
FROM genotypedata
WHERE sex = 2
AND phenotype = 2;
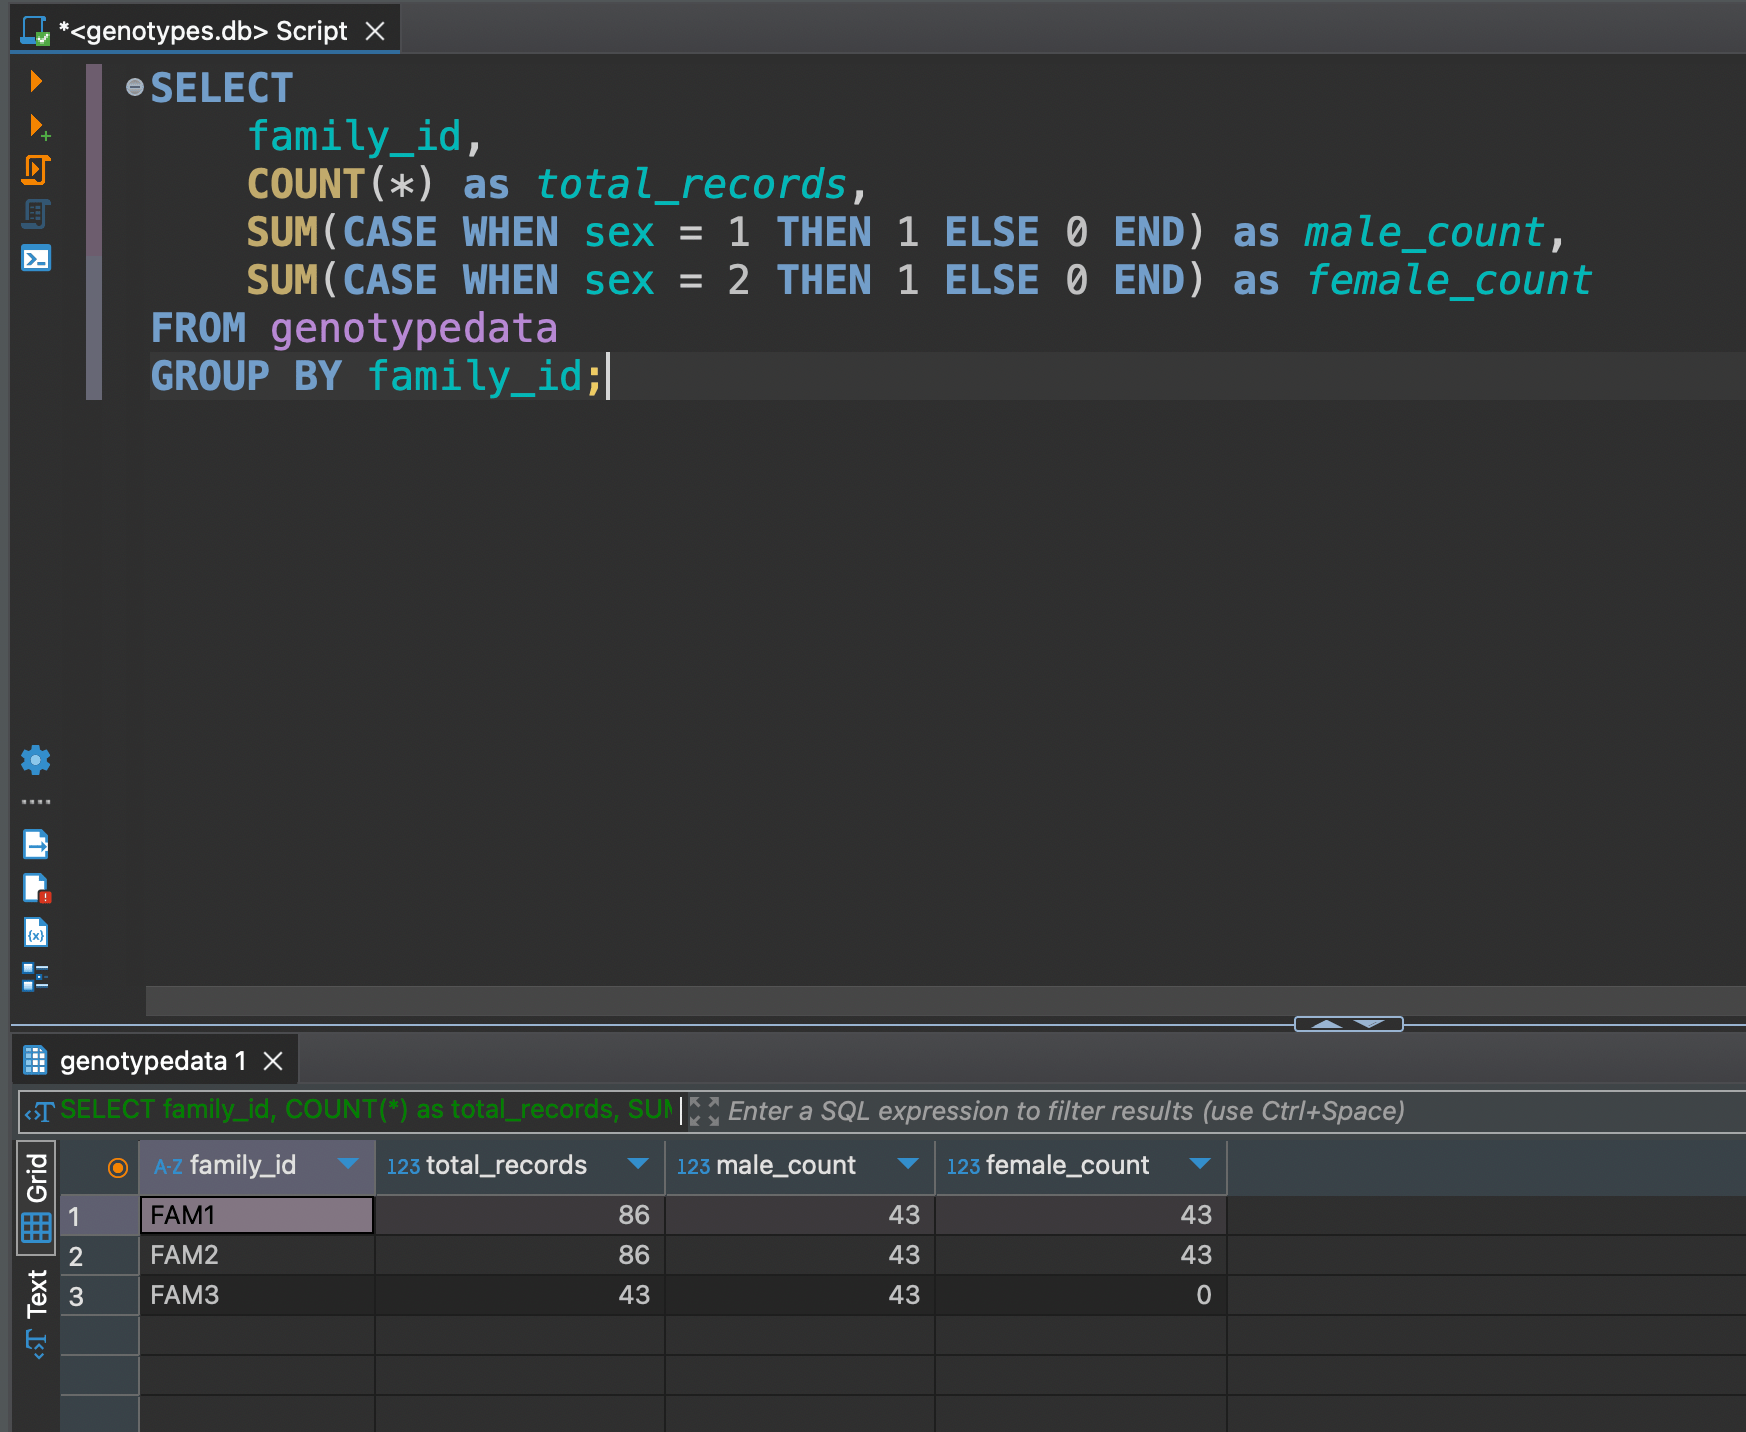
SELECT
 family_id,
 COUNT(*) as total_records,
 SUM(CASE WHEN sex = 1 THEN 1 ELSE 0 END) as male_count,
 SUM(CASE WHEN sex = 2 THEN 1 ELSE 0 END) as female_count
FROM genotypedata
GROUP BY family_id;
Get total records and split by sex
Advanced SQL
Let's say we want to see Genotype Distribution by Phenotype analyzing relationships between genotypes and phenotypes
SELECT
 phenotype,
 snp1,
 COUNT(*) as count,
 ROUND(COUNT(*) * 100.0 / SUM(COUNT(*)) OVER (PARTITION BY phenotype), 2) as percentage
FROM genotypedata
GROUP BY phenotype, snp1
ORDER BY phenotype, count DESC;
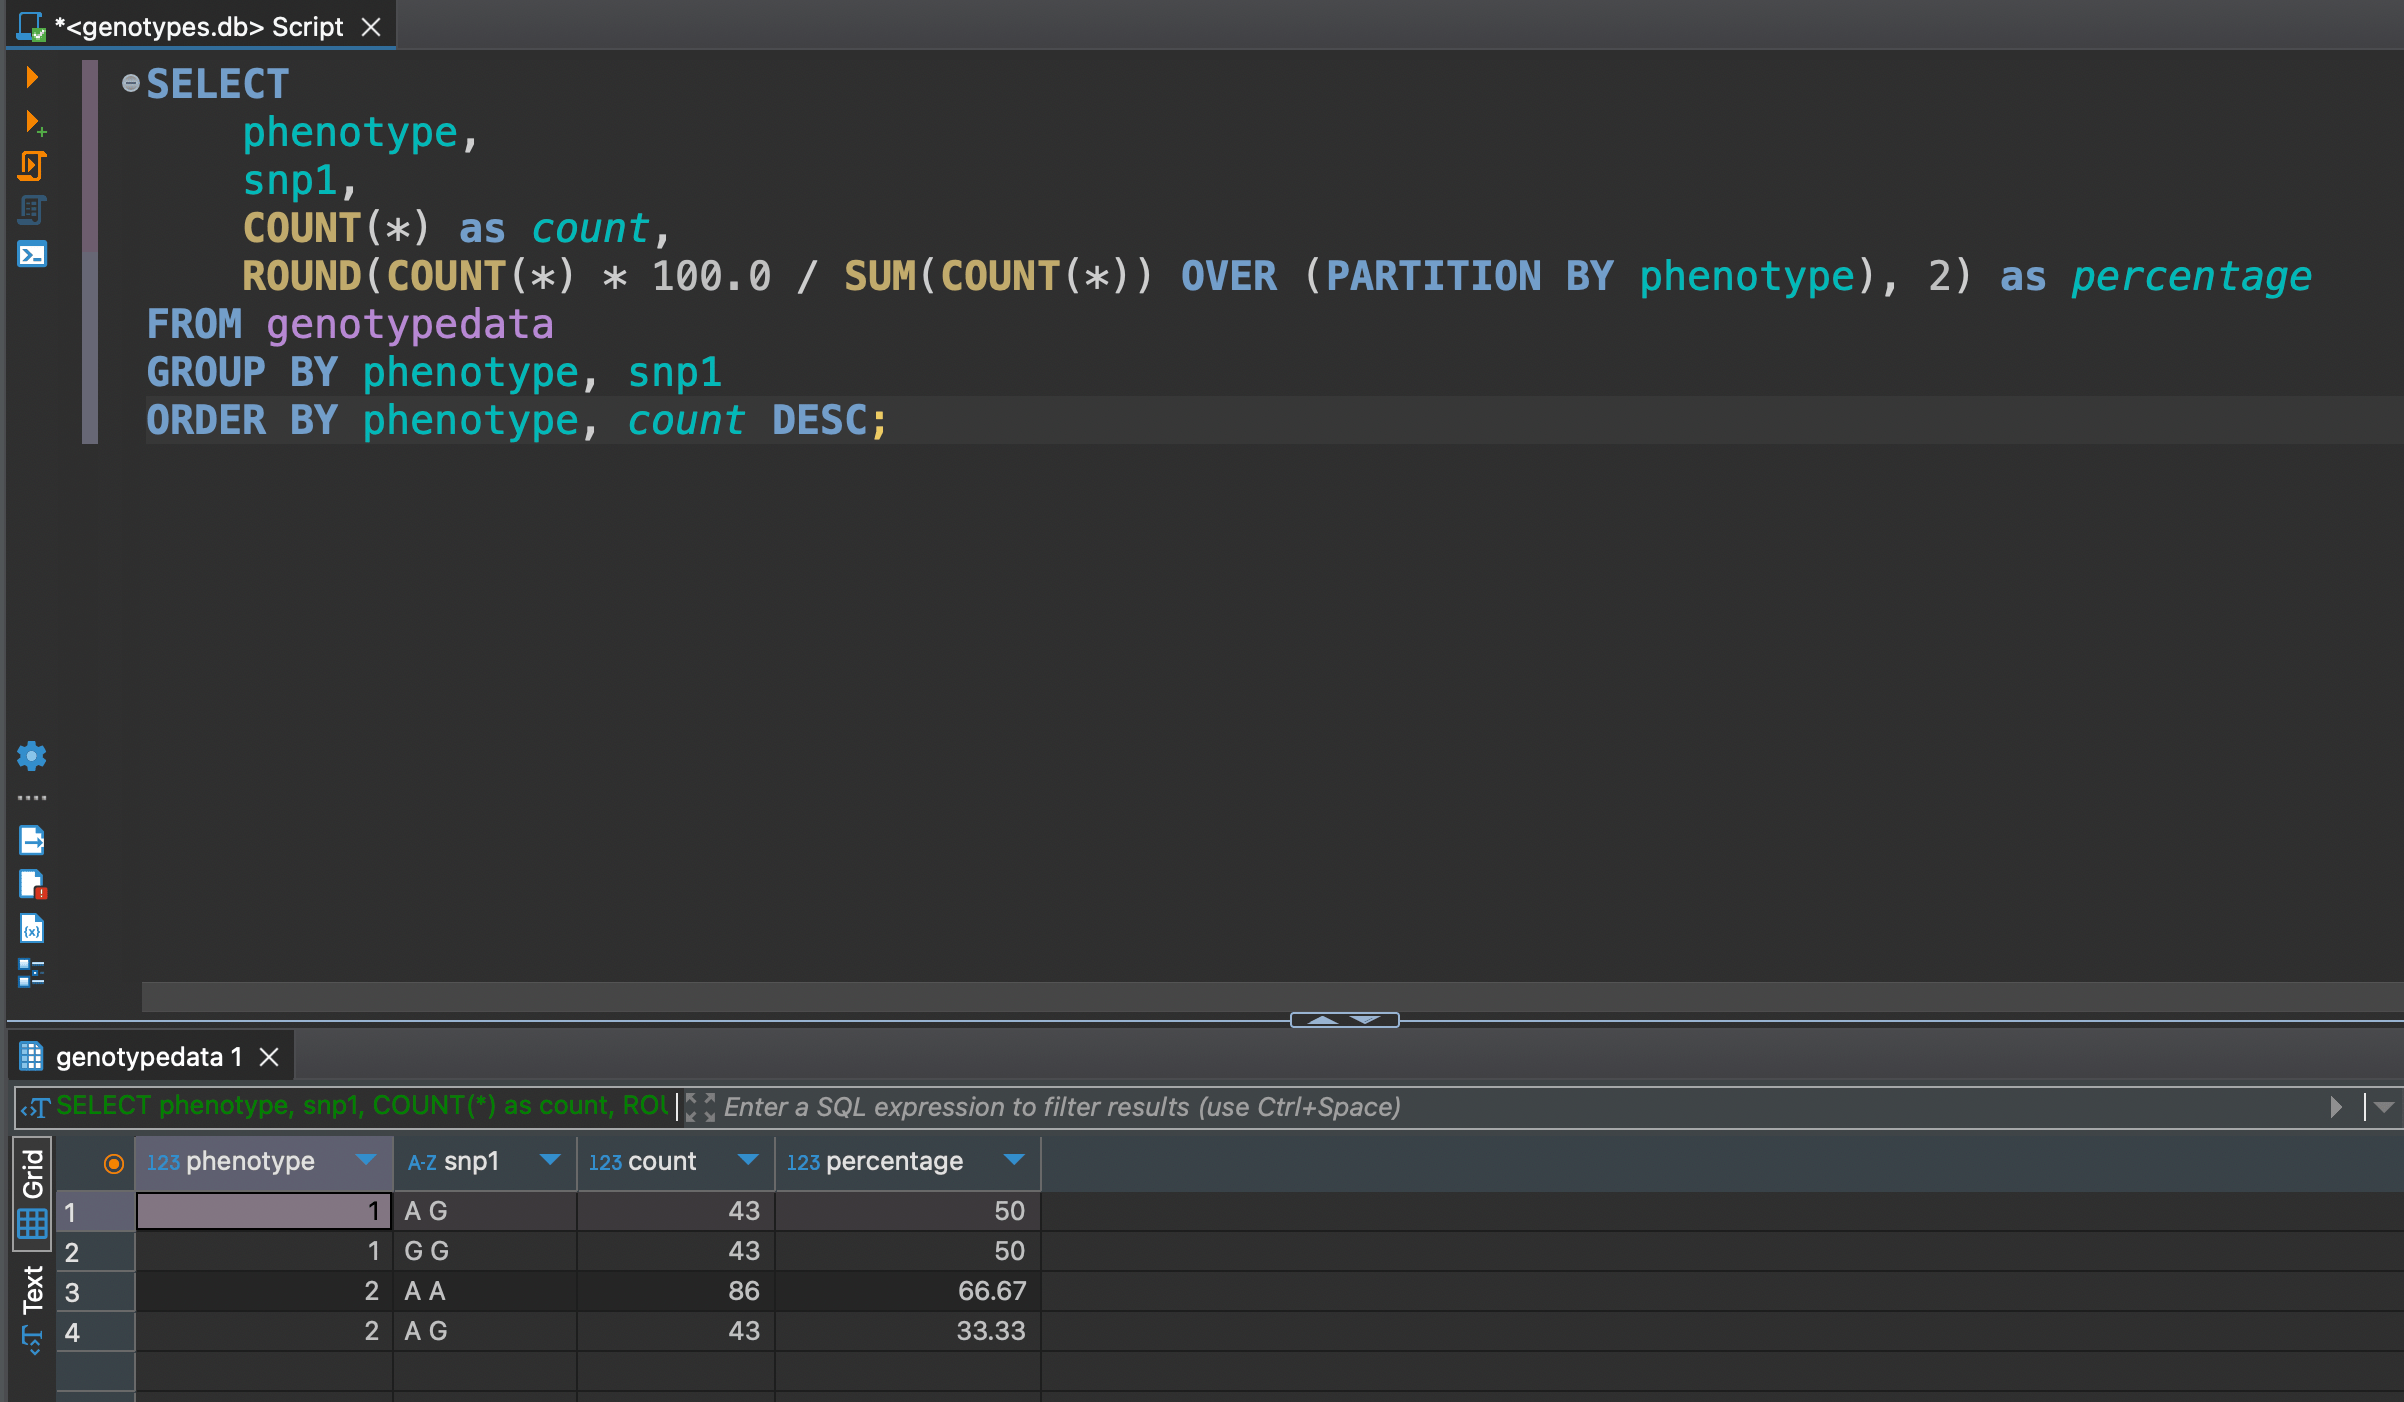
We can see that between snp1 of phenotype 1 is evenly distributed in 50 / 50, but not much for phenotype 2 where distribution is 67 / 33
Hardy-Weinberg Equilibrium (HWE) Check
It's based on a fundamental principle: in a stable population, the frequency of genotypes should follow a predictable pattern unless something is interfering.
WITH allele_counts AS (
 SELECT
  COUNT(*) as total,
  SUM(CASE WHEN snp1 LIKE 'A A' THEN 1 ELSE 0 END) as AA,
  SUM(CASE WHEN snp1 LIKE 'A G' OR snp1 LIKE 'G A' THEN 1 ELSE 0 END) as AG,
  SUM(CASE WHEN snp1 LIKE 'G G' THEN 1 ELSE 0 END) as GG
 FROM genotypedata
)
SELECT
 AA as observed_AA,
 AG as observed_AG,
 GG as observed_GG,
 ROUND(POWER((2*AA + AG)/(2.0*total), 2) * total, 2) as expected_AA,
 ROUND(2 * ((2*AA + AG)/(2.0*total)) * ((2*GG + AG)/(2.0*total)) * total, 2) as expected_AG,
 ROUND(POWER((2*GG + AG)/(2.0*total), 2) * total, 2) as expected_GG
FROM allele_counts;
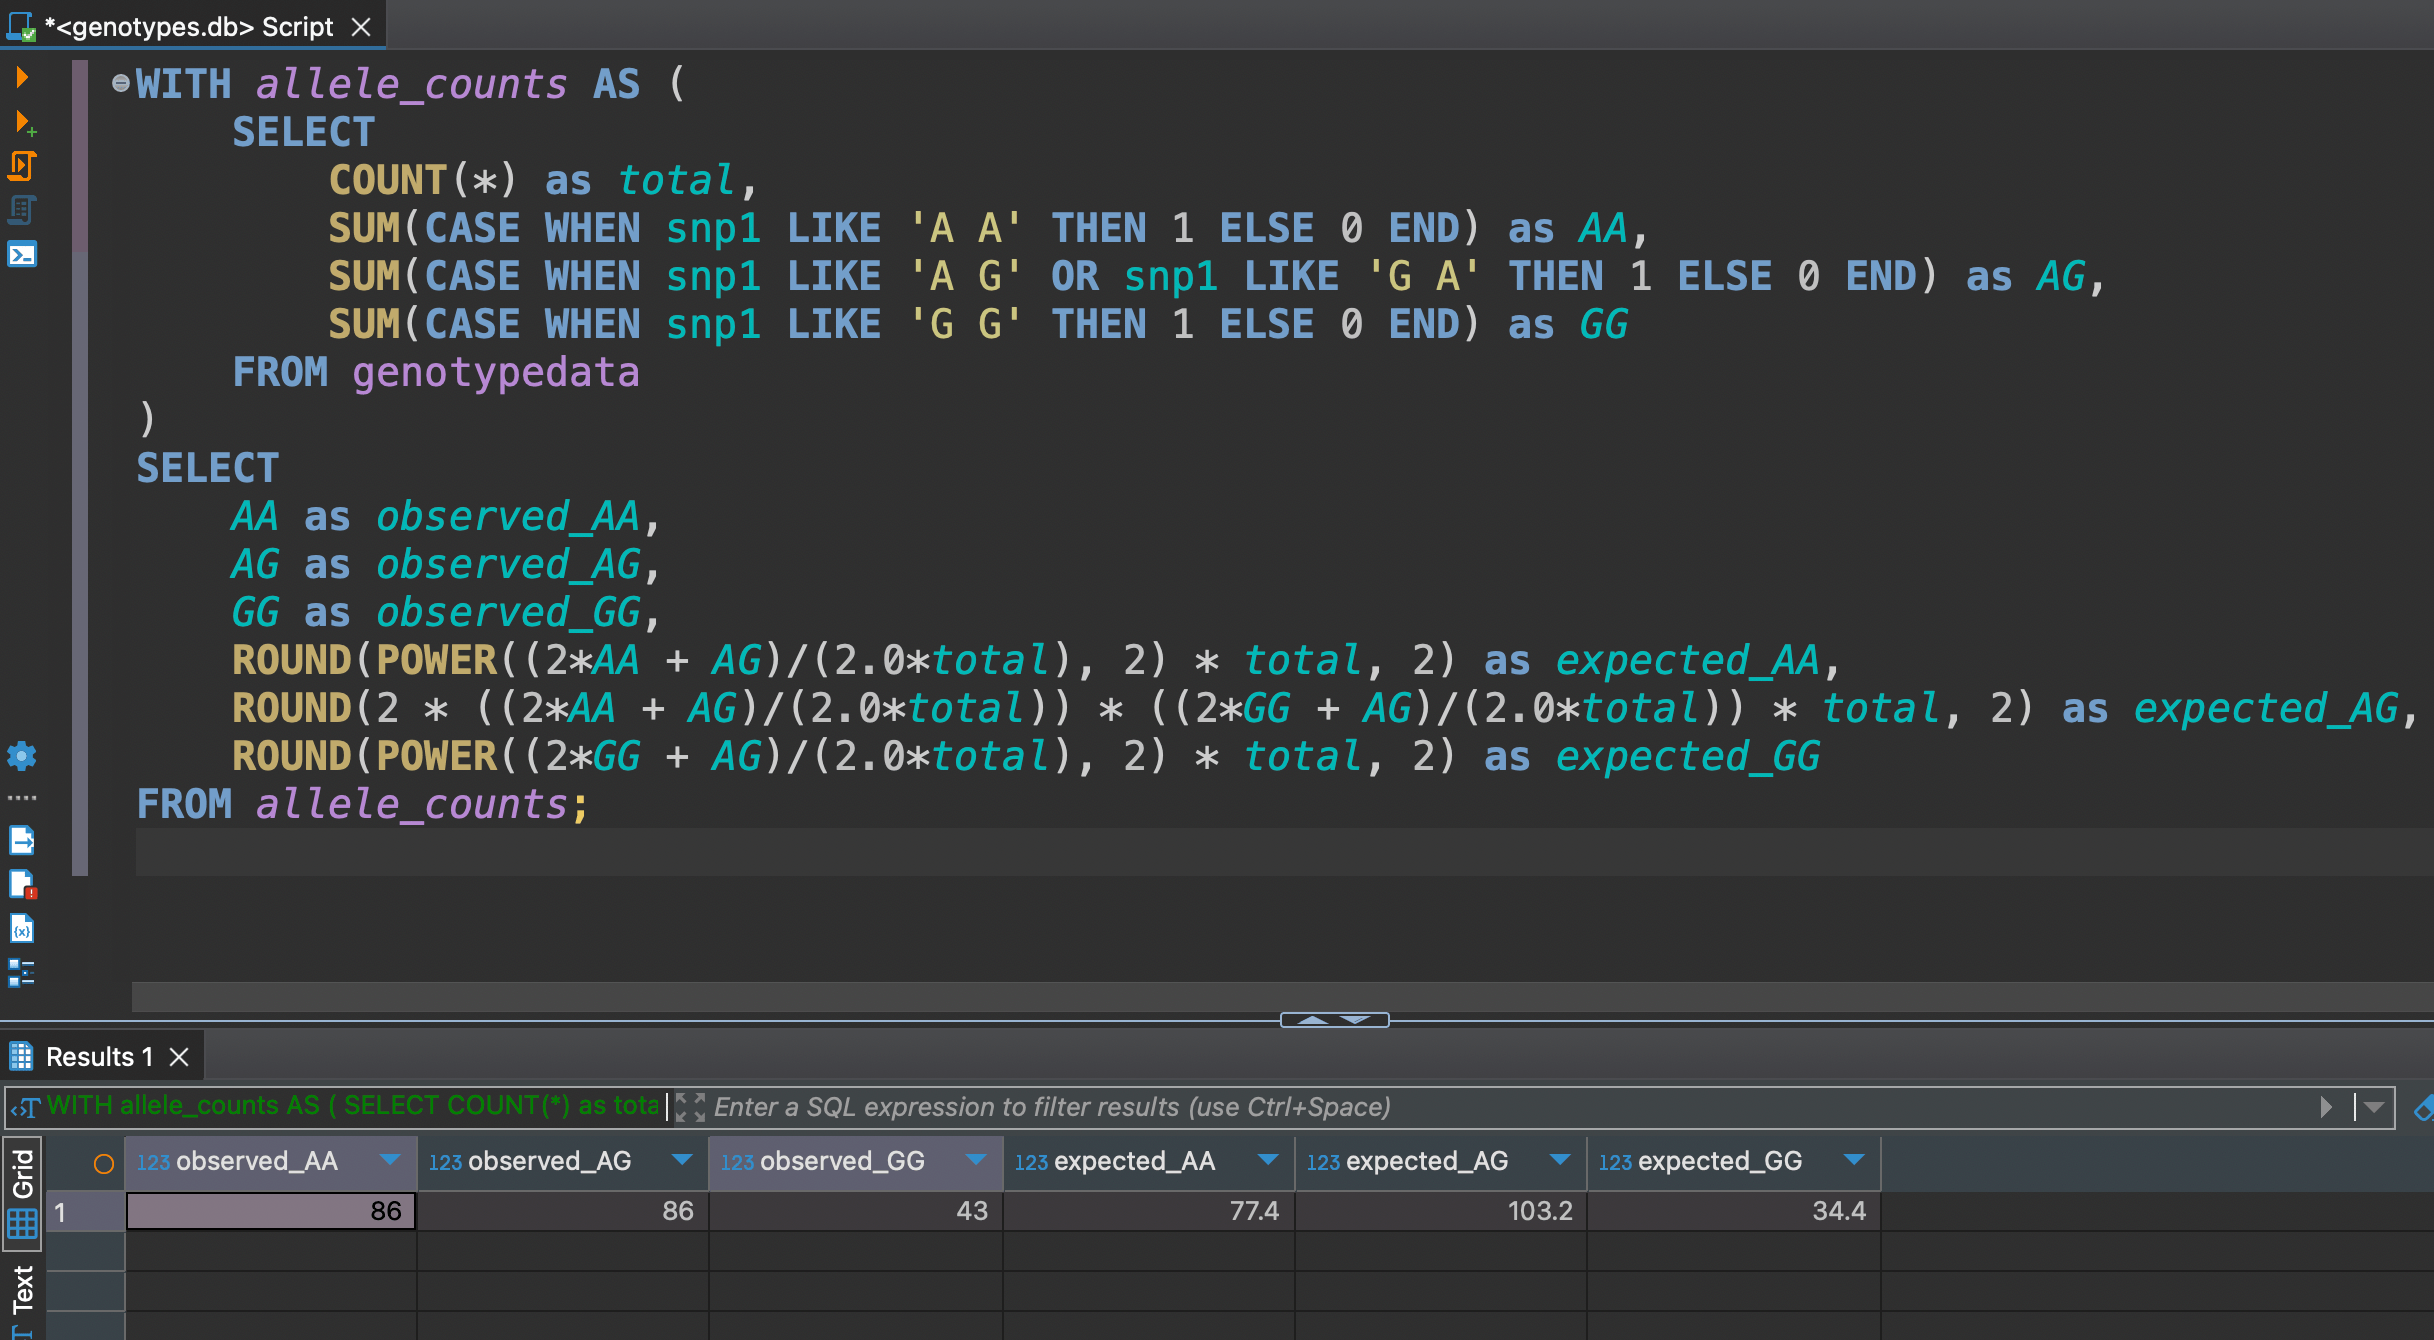 The differences between observed and expected aren't large, but noticeable enough to warrant attention in quality control processes.
Wrapping Up: From Lab Benches to Database Queries 🧬
We've come quite a journey from those text-based PLINK files to a fully-functional SQL database. Pretty cool transformation, right?
Here's what you've accomplished:
- Set up a modern Python project faster than you can say "nucleotide sequencing"
- Transformed genetic data into queryable gold using SQLite
- Learned to use use SQL queries (and even tackled Hardy-Weinberg equilibrium!)
The best part? This is just the beginning. With your genetic data now living in a proper database, you've opened up a whole new world of possibilities for analysis and collaboration.
Keep experimenting, keep querying, and most importantly - keep pushing the boundaries of what's possible with your data!
Yours,
Bad Dog
P.S. Remember: Every great bioinformatician started somewhere. Today, that somewhere was turning PLINK files into SQL magic! 🪄